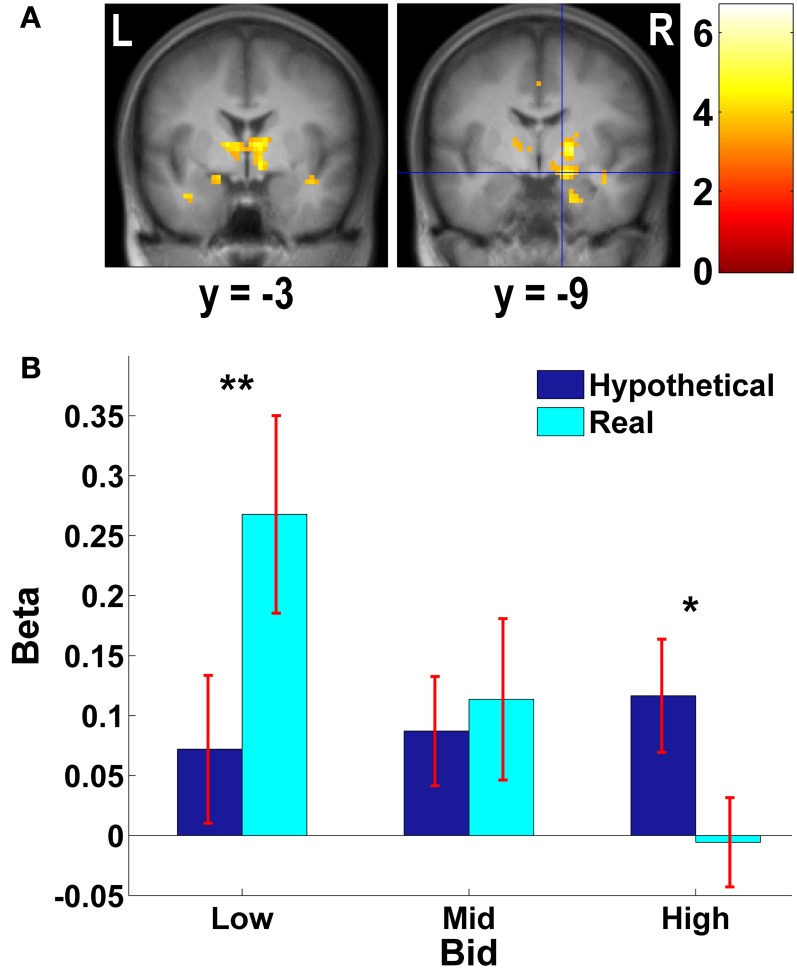
Figure 4.
Subcortical areas exhibiting higher negative correlation with real bids than hypothetical bids. (A) Deactivations in the [real × bid - hypothetical × bid] contrast (p < 0.001, uncorrected; threshold k ≥ 5 voxels). The color bar on the right indicates the t-score. (B) Average response in the amygdala area to different levels of bids by trial type. Due to continuous activations in surrounding areas, the amygdala mask was defined as an intersection of the two following regions: (1) a right amygdala area (local peak at x = 15, y = −9, z = −12) identified in the [real × bid - hypothetical × bid] contrast [the area with crosshairs shown in the right panel of (A)]; and (2) a 8-mm sphere centered at the local peak of the area in (1) at x = 15, y = −9, z = −12. β values extracted from this amygdala mask. **p = 0.015, *p = 0.034, no asterisk = not significant, paired two-sample t-test.

