Figure A5.

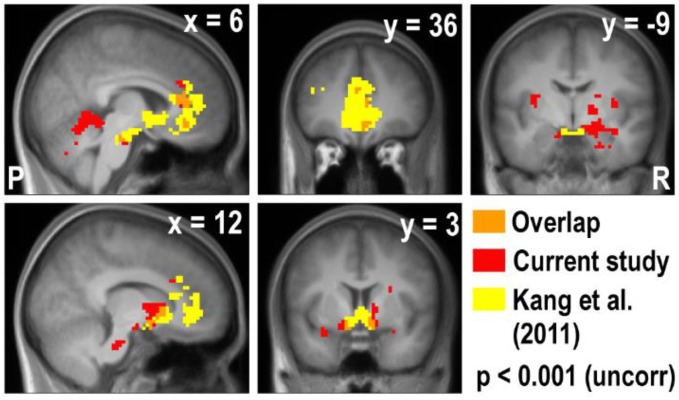
Overlay of the deactivation map of the real × bid contrast and the activation map of the real × mDV contrast in Kang et al. (2011). The vmPFC, ACC, and striatum appear in both studies, but the amygdala only appears in the current study.

Overlay of the deactivation map of the real × bid contrast and the activation map of the real × mDV contrast in Kang et al. (2011). The vmPFC, ACC, and striatum appear in both studies, but the amygdala only appears in the current study.