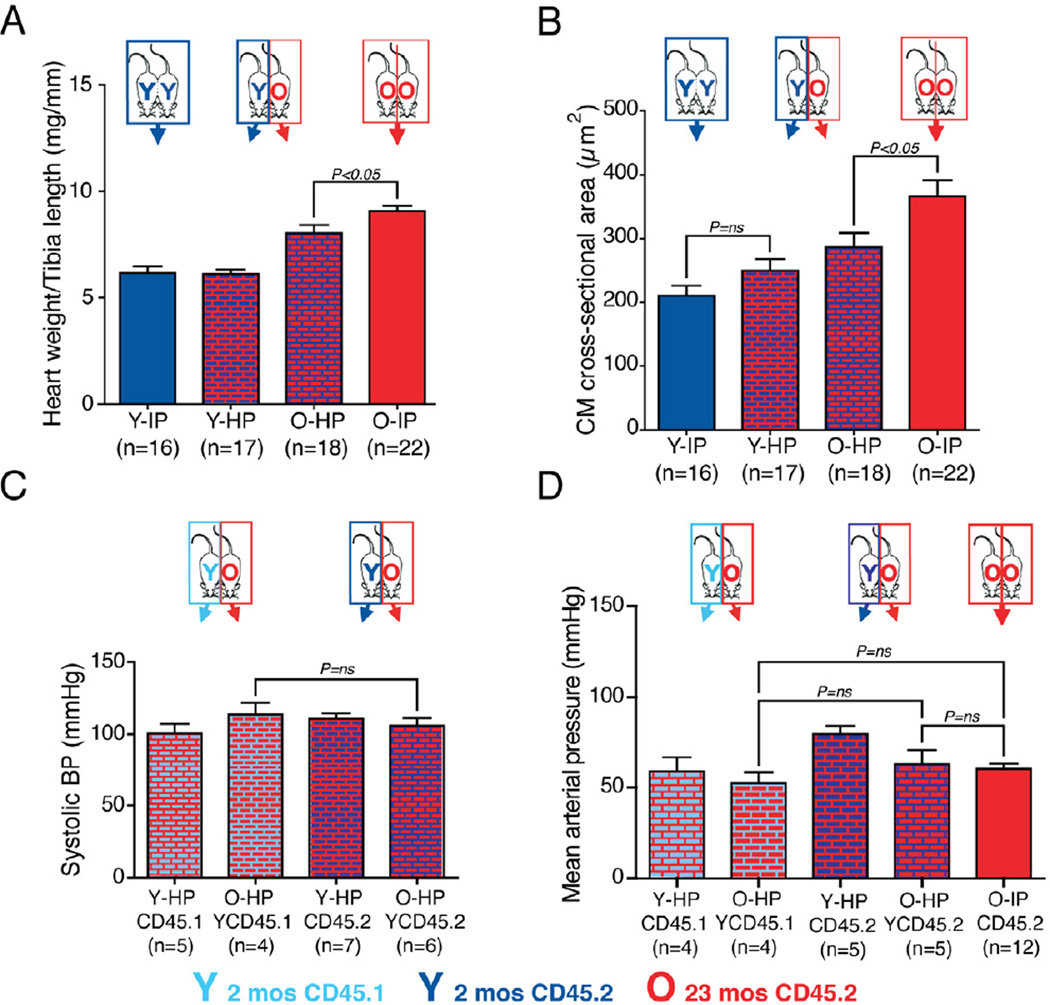
Figure 4. Differences in blood pressure between young CD45.1 and CD45.2 mice do not explain the reversal of cardiac hypertrophy.
(A) Graph representing the heart weight / tibia length ratio after 4 weeks of parabiosis, using only CD45.2 mice.
(B) Left ventricular myocyte cross-sectional area based on PAS staining in CD45.2 mice. Exposure of an old mouse to the circulation of a young CD45.2 mouse reverses cardiac hypertrophy.
(C) Old mice conjoined to young CD45.1 or CD45.2 mice show no difference in blood pressure measured by the tail-cuff system (Fig. 3A) after 4 weeks.
(D) No significant intergroup differences in blood pressure were detected with terminal intra-arterial catheter-based measurements. Data shown as mean ± s.e.m.

