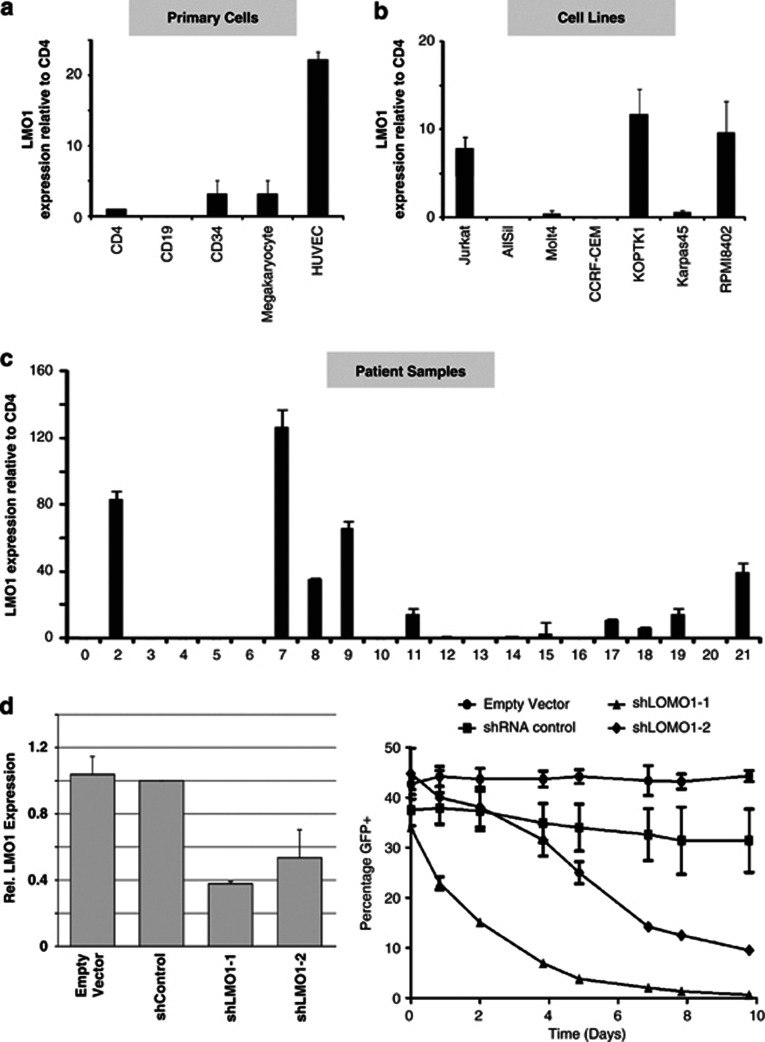
Figure 3.
High LMO1 expression is evident in a significant proportion of T-ALL cell lines and patient samples. (a) Very low level LMO1 expression was observed in CD34 cells and in megakaryocytes at levels not significantly above those seen in CD4 T-cells. By contrast, markedly higher levels of expression were detected in cultured endothelial cells. (b) Three of the seven T-ALL cell lines (Jurkat, KOPTK1 and RPMI8402) had LMO1 expression levels significantly above those in CD4 T-cells, two cell lines had similar LMO1 expression levels to those seen in CD4 T-cells (Molt4 and Karpas45) with the remainder having undetectable levels of expression (AllSill and CCRF-CEM). (c) Nine of twenty-one primary T-ALL samples assayed showed high levels of LMO1 expression with three (patients 2, 7 and 9) showing very high levels of LMO1 expression. (d) LMO1 expression is reduced by shRNA knockdown, leading to lower cell proliferation. Two shRNA LMO1 knockdown vectors were designed using the RNAi Central webtool (http://katahdin.mssm.edu/siRNA/RNAi.cgi?type=shRNA) and cloned into the GFP-encoding pLL3.7 plasmid. Jurkat cells were transduced and both shRNA constructs (shLMO1-1 and shLMO1-2) showed marked reduction in LMO1 expression compared with the negative control shRNA (shControl) and empty vector. Moreover, growth of shRNA-transduced cells was markedly reduced for cells transduced with shLMO1-1 and shLMO-2, compared with empty vector and the negative control. Data shown are from a representative biological replicate experiment performed in duplicate.

