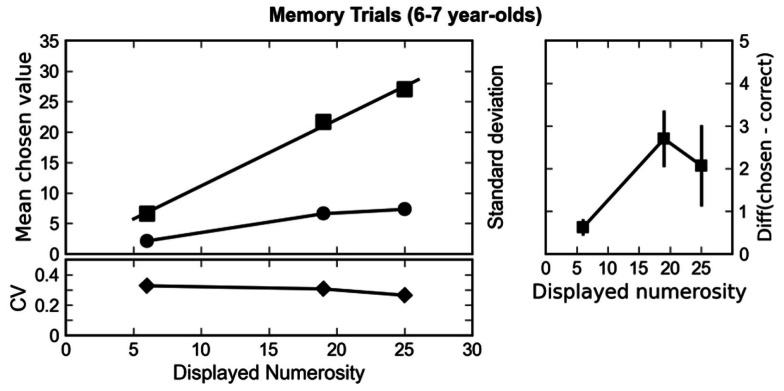
Figure 2.
Left column: mean responses (chosen values, squares) of the subjects and standard deviations (circles) plotted against the correct outcome for memory trials. The lower part depicts the coefficient of variation (CV, diamonds) – that is, the ratio of standard deviation and mean chosen value, plotted against the displayed numerosity. A constant coefficient of variation indicates that variability of chosen values increased proportionally with mean chosen value. In turn, this can be understood as an instantiation of Weber’s law. Right column: the difference between the displayed numerosity and the chosen value plotted against the displayed numerosity. Positive values indicate that children tended to overestimate the remembered numerosities. Error bars indicate the standard error of the mean.

