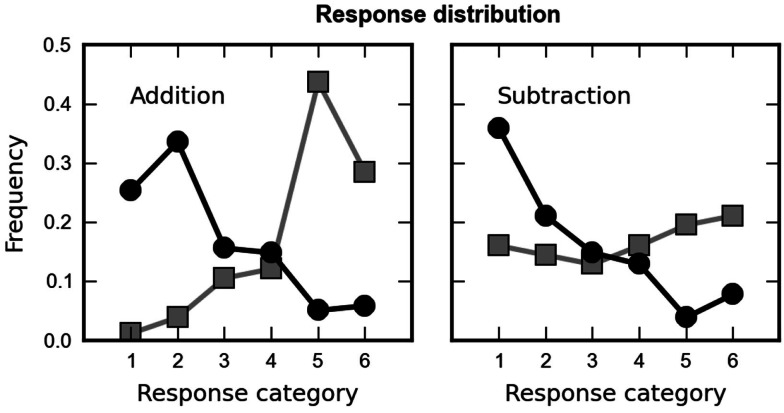
Figure 7.
Distribution of the participants’ choices across the six proposed results, averaged over all arithmetic problems, separately for addition (left column) and subtraction (right column). Responses were not distributed randomly but depended on the range of response alternatives presented (high or low range shown as black squares and gray squares, respectively). Responses were centered around the values that were closest to the correct outcome (fifth for low range and second for high range).

