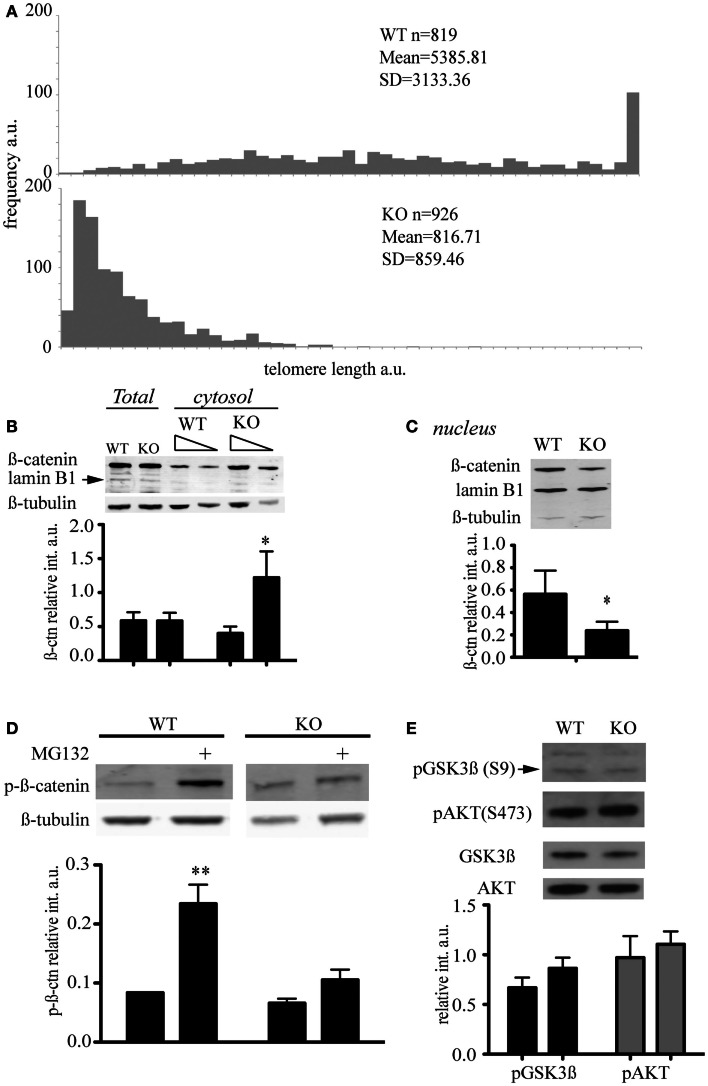
Figure 2.
Telomere shortening affects β-catenin cellular distribution and its degradation. (A) Q-FISH analysis of wild-type (WT) and mTert−/− mESC (KO) at passage 61 and 70 respectively (P < 0.001). (B) Immunoblot of total and cytosolic cell extract of WT and KO mESC at passage>60. The membrane was probed with an anti-total β-catenin antibody and anti-β-tubulin antibody. Anti-lamin B antibody was used to assess the purity of the cytosolic fractionation (10 and 5 μg loaded, respectively). The signal for cytosolic β-catenin was quantified relative to the signal for β-tubulin (IRDye® Infrared Dyes, LI-COR Biosciences). (C) Immunoblot of nuclear cell extract of WT and KO mESC at a passage>60. The membrane was probed with an anti-total β-catenin antibody and an anti-lamin B1 antibody. Anti-β-tubulin antibody was used to assess the purity of the nuclear fractionation. The signal for nuclear β-catenin was quantified relative to the signal for lamin B1. (D) Immunoblot of phosphorylated β-catenin in cytosolic cell extracts treated with (+) and without the proteasome inhibitor MG132 (10 μM) for 6 h. The signal for cytosolic phospho-β-catenin was quantified relative to the signal for β-tubulin. The histograms in (A–C) represent the data of the blot shown plus two other independent data sets (average ± standard deviation; Student’s t-test: *P < 0.05, **P < 0.01). (E) Enhanced chemiluminescence immunoblot of total cell extract of WT and KO mESC probed with anti-phospho-GSK (S9), anti-total GSK, anti-phospho-AKT (S473), and anti-total AKT antibodies. The blot shown is representative of at least three independent experiments. The signal of p-GSK3β and p-AKT was quantified relative to the total unphosphorylated protein, GSK, and AKT respectively. The histograms represent the average of four independent analyses, P = 0.057 for p-GSK3β and P = 0.39 for p-AKT. Error bars indicate standard deviation.

