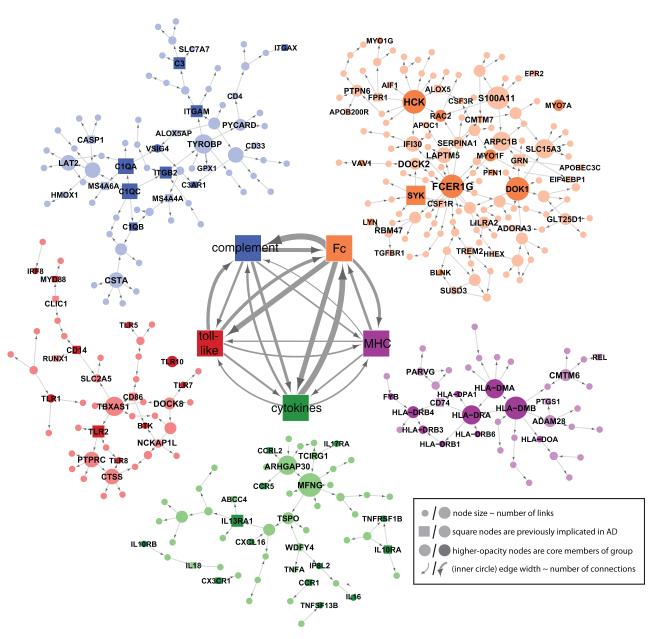
Figure 5. The Bayesian Brain Immune and Microglia Module.
A module that correlates with multiple LOAD clinical covariates and is enriched for immune functions and pathways related to microglia activity (PFC module shown). [Inner networks] The PFC module is enriched in genes which can be classified as members of the complement cascade, ‘Complement’, toll-like receptor signaling, ‘Toll-like’, chemokines/cytokines, ‘Chemokine’, and the major histocompatibility complex, ‘MHC’, or Fc receptor system, ‘Fc’. The direction and strength of interactions between these pathways are collected across all gene-gene causal relationships that span different pathways. The minimum line width corresponds to a single interaction (MHC to toll-like) and scales linearly to a maximum of 17 interactions (Fc to Complement). [Outer networks] Each color-coded group of genes consists of the core members of the different families and genes that are causally related to a given family. Core family members of each pathway are shaded darkly, while square nodes in any family denote literature-supported nodes (at least two PubMed abstracts implicating the gene or final protein complex in LOAD or a model of LOAD). Labeled nodes are either highly connected in the original network, literature-implicated LOAD genes or core members of one of the five immune families. Node size is proportional to connectivity in the module. See also Figures S5.

