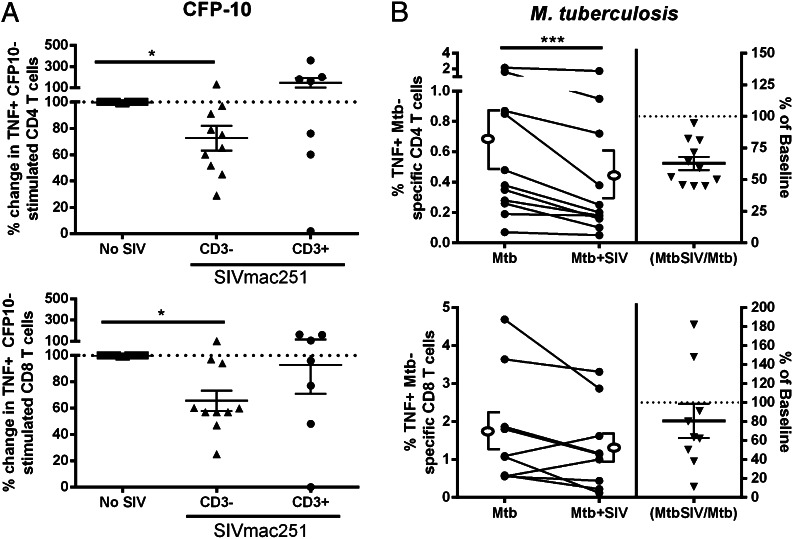
FIGURE 2.
Reductions in the frequency of TNF-producing peripheral T cells is caused by SIV-manipulating, T cell–depleted-PBMCs. (A) SIV-incubated, T cell–depleted PBMCs (CD3−) had lower frequencies of TNF-producing CD4 (CD3−; n = 10 animals) and CD8 (CD3−; n = 10 animals) T cells. Incubation of T cells with SIV did not reduce frequencies of TNF+ CD4 (CD3+, n = 7 animals) or CD8 (CD3−; n = 7 animals) T cells. The dotted line represents baseline TNF production by T cells without added SIV (No SIV; n = 10 animals). Mean ± SEM are included in each of the columns. Kruskal–Wallis with Dunn’s multiple comparison test with significance set at p < 0.05. (B) TNF expression by CD4 and CD8 T cells incubated with CD3-depleted PBMC that has been infected with M. tuberculosis and SIV (Mtb+SIV) without SIVmac251 (Mtb). SIV reduced TNF production in CD4 T cells (n = 11 animals). Open ellipse and bracket to the left and right of the line graphs represent mean ± SEM. Data presented in (B) are the same as Fig. 1. Wilcoxon matched-pairs signed rank test was used with significance set at p < 0.05. The p values that indicate significance are represented. *p < 0.05, ***p < 0.005.

