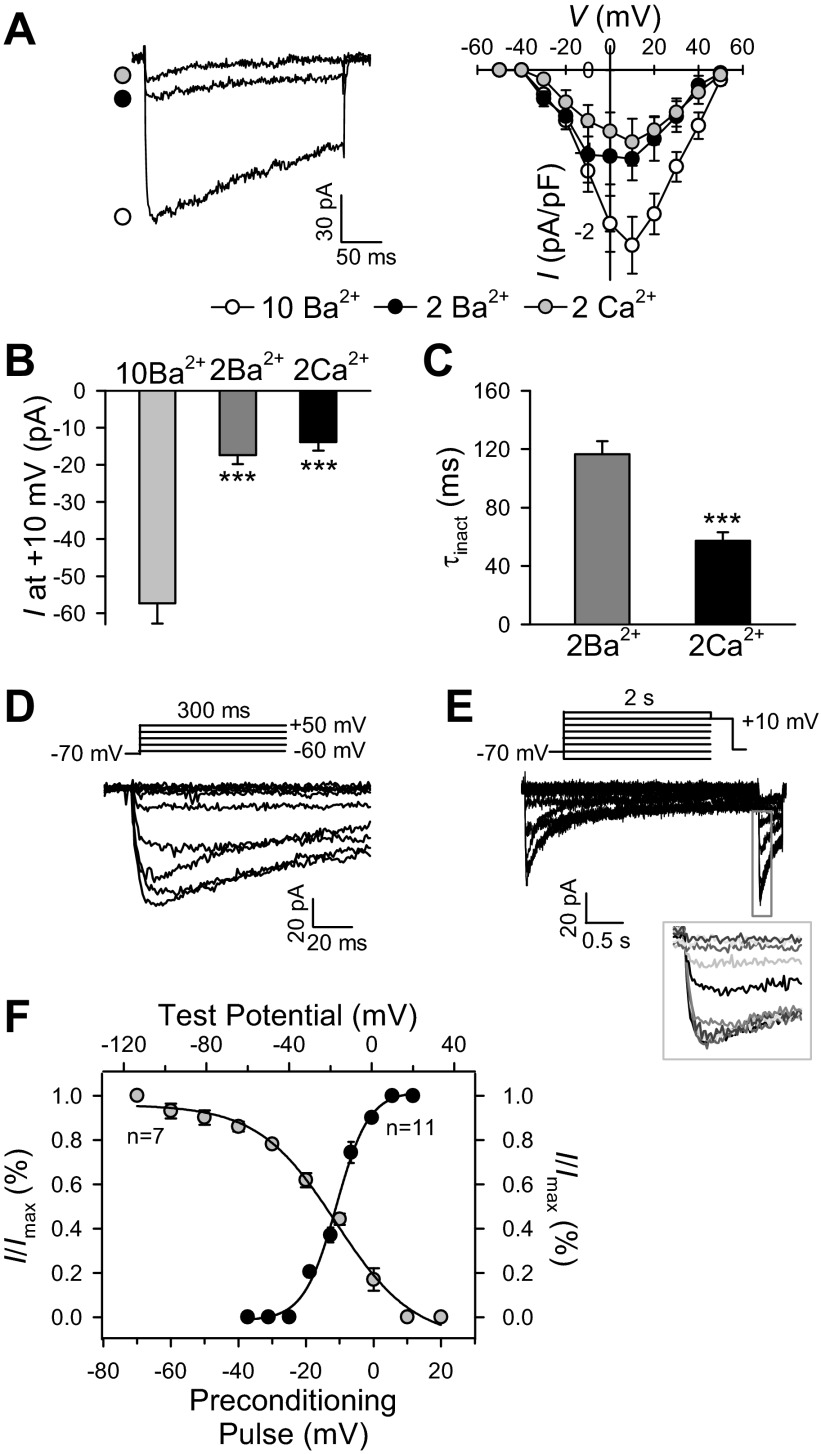
Fig. 3.
Ca2+ permeability and steady-state voltage dependence of inactivation and activation of VDCC in freshly dissociated mouse PASMC. A: representative recording of inward currents through VDCC elicited by a depolarizing pulse of +10 mV from a holding potential of −70 mV (left). Maximum currents were superimposed in the presence of 10 mM Ba2+, 2 mM Ba2+, and 2 mM Ca2+. Right: mean current-voltage (I-V) curves for 10 mM Ba2+, 2 mM Ba2+, and 2 mM Ca2+. Peak currents were determined at each voltage, normalized to cell capacitance. Voltage-clamp steps were applied from a holding potential of −70 mV to test potentials ranging from −60 to +50 mV with increments of 10 mV (300-ms steps). B: bar graph shows the peak currents in the presence of 10 mM Ba2+, 2 mM Ba2+, and 2 mM Ca2+. C: inactivation time constant, τinact, was measured by fitting a monoexponential curve to the decaying phase in the presence of 2 mM Ba2+ and 2 mM Ca2+, respectively. D: representative family of superimposed currents, elicited by depolarization from a holding potential of −70 mV to test potentials (300 ms) ranging from −60 to +50 mV (in 10-mV increments). E: representative family of currents, elicited by a double-pulse protocol, to construct steady-state inactivation curve. The cell was held at −70 mV and stepped to a series of conditioning pulses (2 s) ranging from −90 to +20 mV before depolarization to +10 mV for 200 ms. Inset: magnified inactivation currents. F: averaged data showing the activation curve (closed circle, n = 11 cells) and the inactivation curve (open circle, n = 7 cells). Smooth curves through inactivation and activation data points are the best fit generated by the computer. Peak current was determined at each voltage, normalized to cell capacitance. Data are expressed as means ± SE. Cells were isolated from 5–9 mice. ***P < 0.001, statistical difference from the control value.

