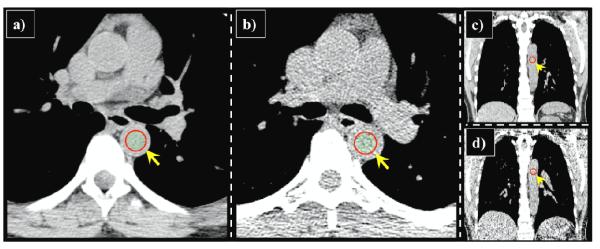
Figure 3. CT noise estimation.
Estimates of the relative noise ratio between (a, c) iBH- and (b, d) eBH-CT were determined by quantitative assessment of the CT numbers within manually placed 1.5 cm diameter spherical ROIs (indicated by yellow arrow). Visually, the eBH-CT clearly demonstrates increased mottled appearance within soft-tissue structures compared to corresponding iBH-CT. The COV ratio indicates average relative noise increase of 2.2× for the set of 10 cases included in this study. The increase is due to the (4:1) acquisition tube current ratio, and the use of edge-enhancing BONE reconstruction kernel.

