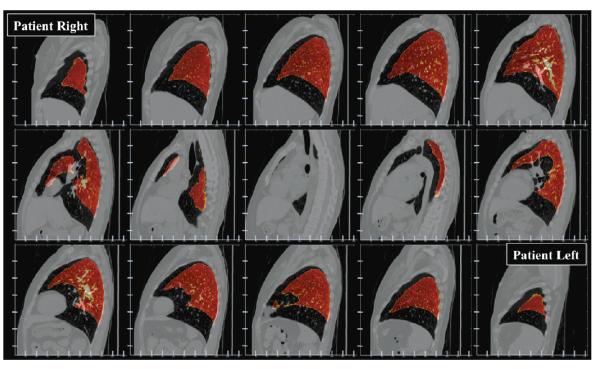
Figure 4. Extreme volume chang.
Fusion image is shown depicting the iBH-CT in sagittal section, with overlay of the contoured eBH-CT lung volume (orange color-scale) in 25-slice increments. Vertical-axis tick marks are spaced in 20-voxel (50 mm) increments from the top of the axis. Horizontal-axis tick marks are spaced in 50-voxel (32.35 mm) increments from the left. The figure illustrates considerable magnitude lung motion in AP and SI component directions. Maximum distance between the inferior contoured lung boundaries is on the order of 40 image voxels.

