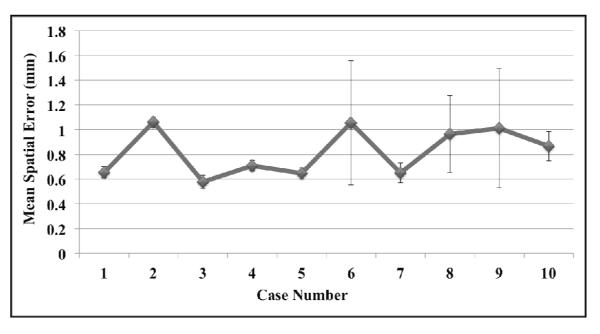
Figure 5. Observer target localization variability.

The average (± standard deviation) of the 3 mean observer localization errors is shown for each case. For cases 6, 8, and 9 the highest observer average was approximately twice that of the lower observer, resulting in the relatively large standard deviations. Combining the set of observer measurements for each case yields average repeat registration errors ≤1.06 mm over the set of 10 cases utilized in this study.
