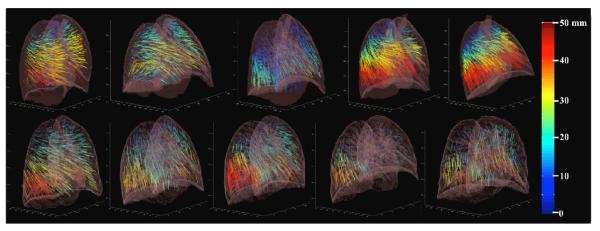
Figure 6. COPDgene BH-CT reference data.

Landmark point pairs were selected on exhale and inhale BH-CT images from 10 COPDgene cases. The number of pairs ranged from 447-1172 for each case. Vector field projections are shown using the color map for displacement length (0 to 50 mm) shown at right. Those vectors with >50 mm displacement are mapped to the same red-colored maximum. The range of displacements varies for each case, reflecting the extent of their COPD disease.
