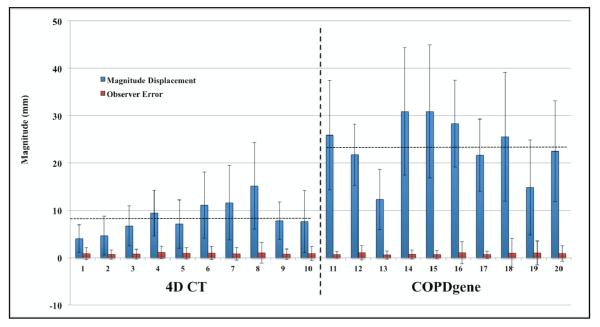
Figure 8. DIR-Lab reference library data.
Mean (± standard deviation) magnitude landmark displacement (blue) is shown adjacent to the corresponding mean (± standard deviation) observer localization error (red). For the 4D CT cases, magnitude displacements are given between the maximum inhalation and exhalation component phase images. Horizontal lines indicate the overall average landmark displacement magnitude for the two imaging cohorts (4D CT: 8.52 mm, COPDgene: 23.46 mm).

