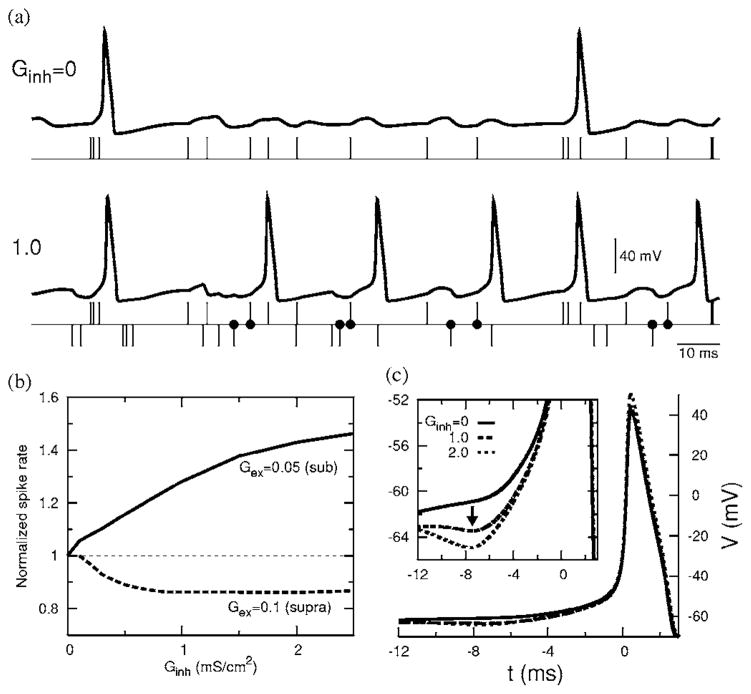
FIG. 1.
Enhancement due to inhibition. (a) Membrane response without and with inhibitory input. The excitatory (e) and inhibitory (i) input arrival times are marked, respectively, by upward and downward vertical lines. Well timed ie pairs marked with dots induce additional spikes (Gex =0.050. (b) The normalized spike rate as a function of Ginh showing enhancement of the firing rate for a subthreshold excitation (Gex =0.05) and suppression for a suprathreshold excitation (Gex =0.1). (c) Reverse correlations of V showing a depression with increasing inhibition (Gex =0.05). (For all figures τex =1 ms, τinh =1 ms, and when applicable λ =100 Hz.)

