
FIG. 3.
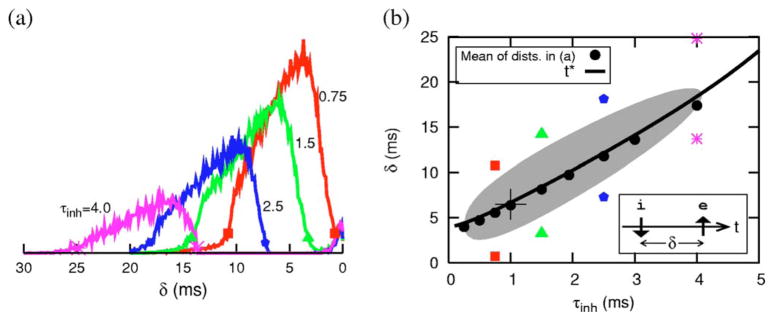
(Color online) δ-window distributions and comparison with response to isolated ie pairs. (a) Distribution of relative timing of i with respect to e immediately preceding a spike onset for different τinh. (b) The mean values of these distributions are plotted (as filled circles) as a function of τinh. The gray region shows the parametric dependence of the width of hypersensitive region shown in 2(b). The solid curve distinguishes two subregions where V > Vrest (gray portion with δ > t*, see text) and where V < Vrest (δ < t*) following an isolated inhibitory input. See text for other markings.