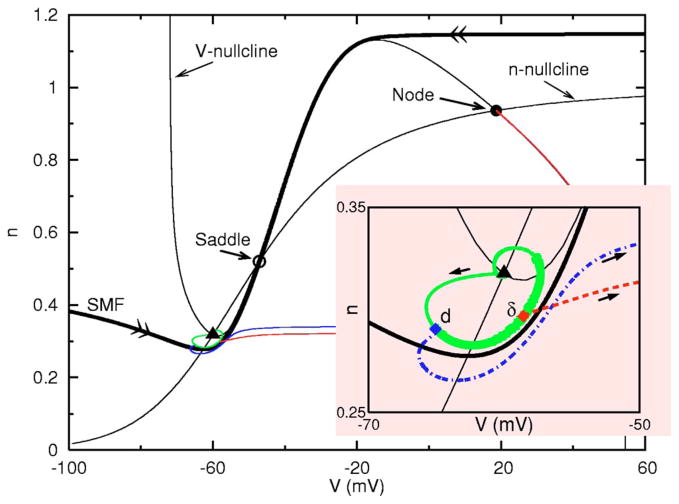
FIG. 4.
(Color online) Demonstration of PIF and PIR in a 2D reduced model. Three trajectories emerging from the rest state in the direction of arrows are shown corresponding to a lone inhibition delivered at t =0 (solid curve, subthreshold oscillation), an inhibition (at t =0) followed by an identical inhibition delivered d(=3) ms later (dot-dashed curve, PIR), and an inhibition (at t =0) followed by an excitation delivered δ(=8)ms later (dashed curve, PIF). The thick portion of the solid curve indicates the reduced threshold region in which PIF may occur. (Gex =0.05, Ginh =1.)

