
Figure 5.
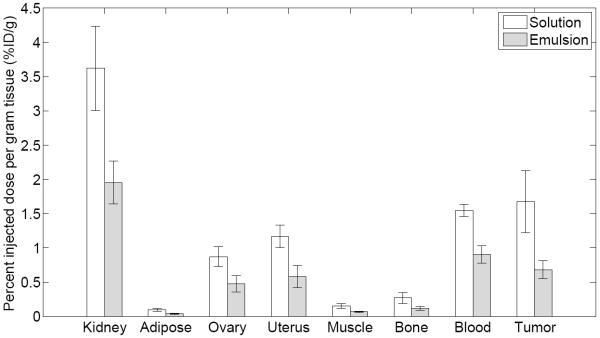

Biodistribution of FDG solution (n = 6) and FDG emulsion (n=6) in Fisher 344 rats with 9L tumors at 3 minutes. The data represent mean and standard deviation of each organ/tissue. In all cases except for the heart and adrenal glands, a statistically significant difference (p < 0.01) was observed when comparing the solution versus the emulsion.