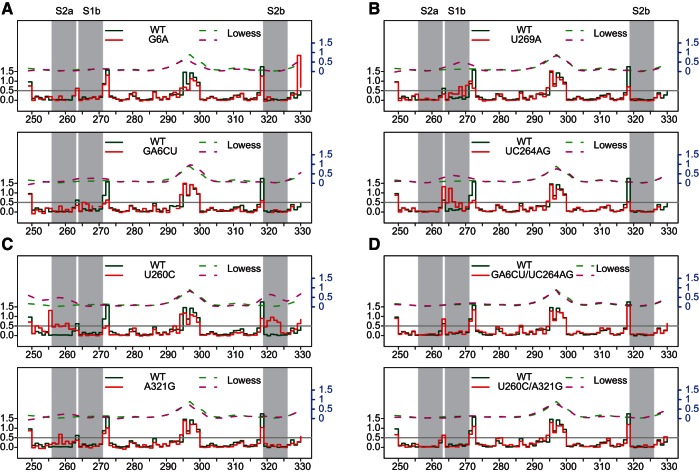
FIGURE 2.
Step plots of NMIA reactivity (left y-axis) of the Ty1 pseudoknot region. (A) S1a mutants, (B) S1b mutants, (C) S2 mutants, and (D) S1/S2 compensatory mutants. Each mutant (solid red line) is plotted against the WT (solid green line) for comparison. Nucleotide positions corresponding to reverse transcriptase stops in the DMSO-control reaction appear as gaps. Lowess smoother fit curves (right y-axis, in blue) over a 10-nt window size were plotted in dashed lines. Nucleotides within the pseudoknot are indicated by gray stripes. The gray horizontal line at 0.5 represents an arbitrarily defined threshold for reactive residues.

