
FIGURE 6.
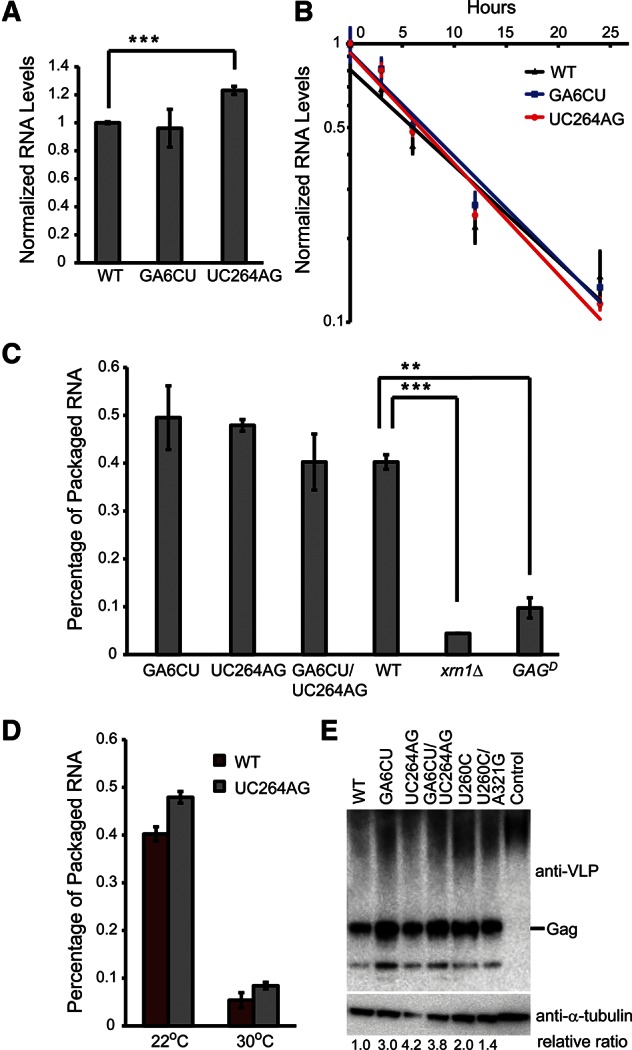
Ty1 RNA half-life and packaging into VLPs are not affected in pseudoknot mutants. (A) Steady state Ty1 RNA levels were measured by QRT-PCR in WT and S1 mutants. RNA levels were normalized to WT, and error bars represent the standard deviation of three biological replicates. (B) Ty1 RNA levels were measured by QRT-PCR at the indicated time points post-glucose exposure. RNA levels in each strain were normalized to the RNA level at the 0-h time point and plotted on a log scale. Solid lines are fitted using an exponential decay function. The slopes of the fitted lines reflect the decay rates of Ty1 RNA. Error bars represent the standard deviation of three replicates. (C) Ty1 RNA levels from samples with and without benzonase treatment were measured by QRT-PCR, and their ratios were plotted as a percentage of packaged Ty1 RNA. Error bars represent the standard deviation of two independently treated lysates. (D) Percentage of Ty1 RNA packaging is shown for WT and the UC264AG mutant at normal (22°C) and high (30°C) temperatures. (**) P < 0.01, (***) P < 0.001. P-values were determined by Student's t-test. (E) Immunoblot analysis of Ty1 Gag from JB970 strains expressing WT or designated mutant Ty1 element. Control lane is the JB970 strain with no plasmid transformed. Protein levels were normalized to α-tubulin levels.