
FIGURE 8.
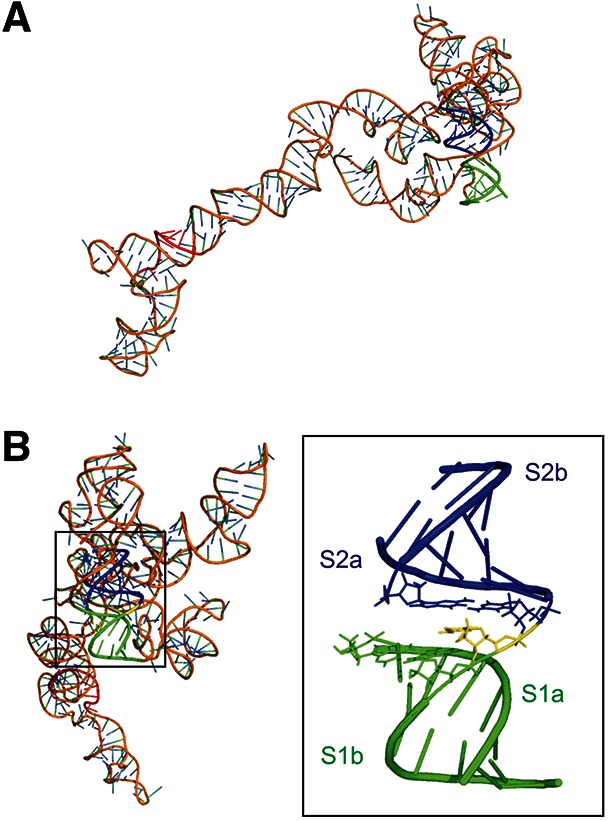
3D structure model of Ty1 RNA (nt 1–362). (A) Relative orientation of the PBS and the pseudoknot. S1 is indicated in green, S2 in blue, C263 in the junction is shown in yellow, Ty1 PBS is shown in red. (B) View rotated 90° along y-axis and pseudoknot with the central segment (nt 7, 262–264, 319) shown as sticks.