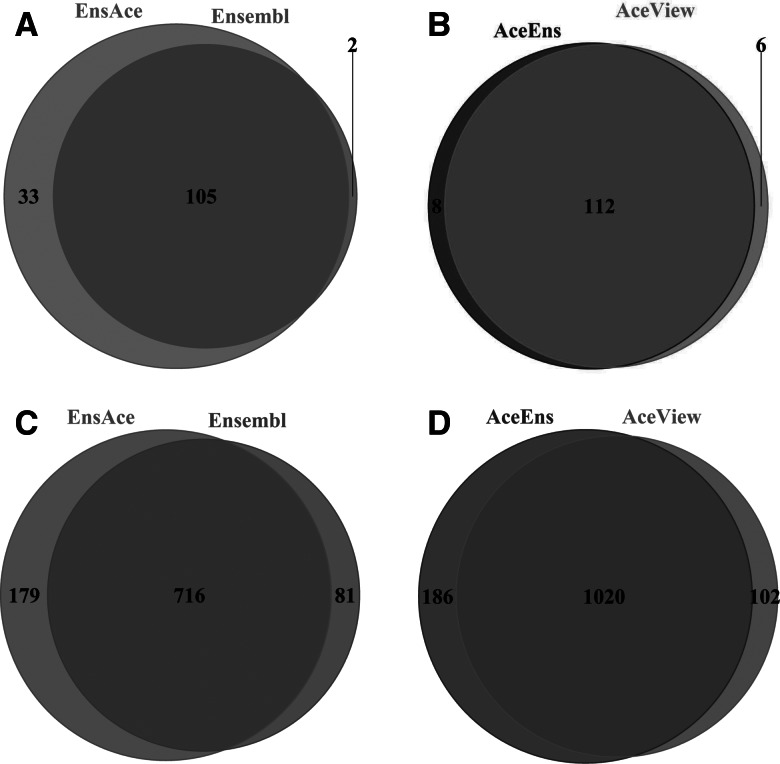
FIGURE 4.
Comparison of differential expression calling among different transcriptomes using brain versus UHR samples. (A) Comparison of detected differentially expressed genes between Ensembl and EnsAce. (B) Comparison of detected differentially expressed genes between AceView and AceEns. (C) Comparison of detected differentially expressed transcripts between Ensembl and EnsAce. (D) Comparison of detected differentially expressed transcripts between AceView and AceEns.

