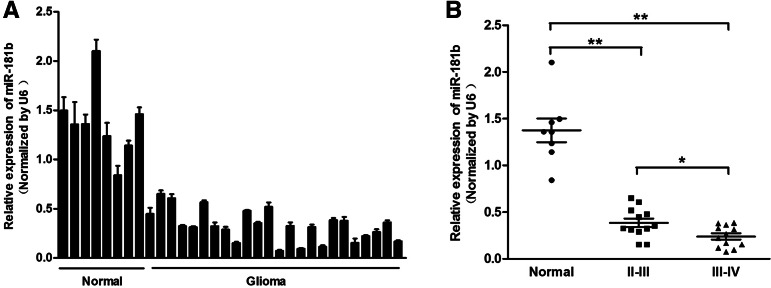
FIGURE 1.
MiR-181b is down-regulated in glioma tissue samples. (A) Expression levels of miR-181b in normal brain tissues and glioma tissues were analyzed by stem–loop qRT-PCR and normalized to the levels of U6. (B) Relative expression levels of miR-181b in different stages of cancer tissues. Twenty-four glioma samples were divided into two groups according to the pathological classification. A Student’s t-test was used to analyze the significant differences among the groups. (**) Significant difference when compared with normal brain tissues (P < 0.01).

