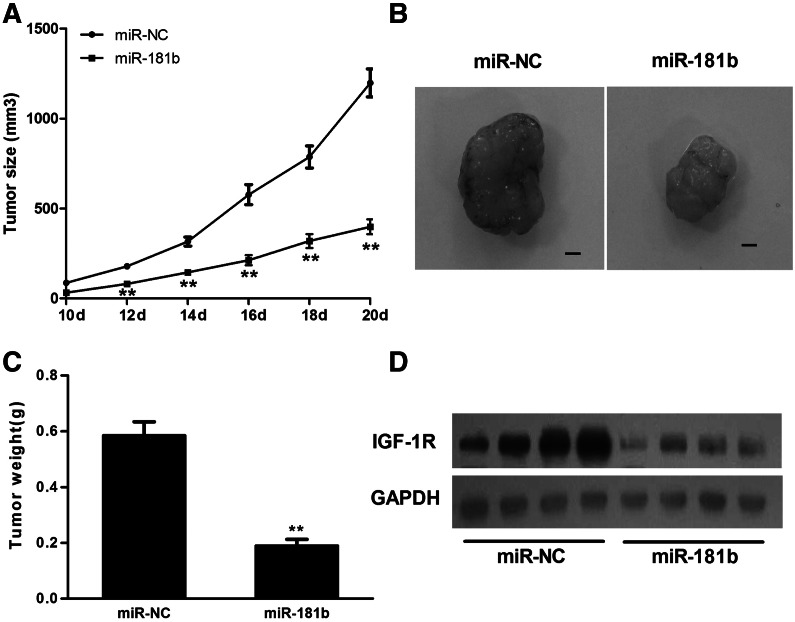
FIGURE 6.
MiR-181b overexpression suppressed tumor growth in vivo. (A) Nude mice were injected subcutaneously with 5 × 10⁶ U87 cells stably expressing miR-181b or miR-NC. Each treatment group contained 10 tumors. When the xenografts were visible, the width and length of tumors were measured. (**) Significant difference when compared with the miR-NC group (P < 0.01). (B) The mice were euthanized on Day 20 and the xenografts were removed. Representative tumors from each group are shown. Scale bar, 2 mm. (C) The tumor weight was measured for each xenograft. (**) Significant difference when compared with the miR-NC group (P < 0.01). (D) Western blot analysis shows that the levels of IGF-1R from the tumor tissues of the miR-181b-expressing group were much lower than those of the miR-NC group.

