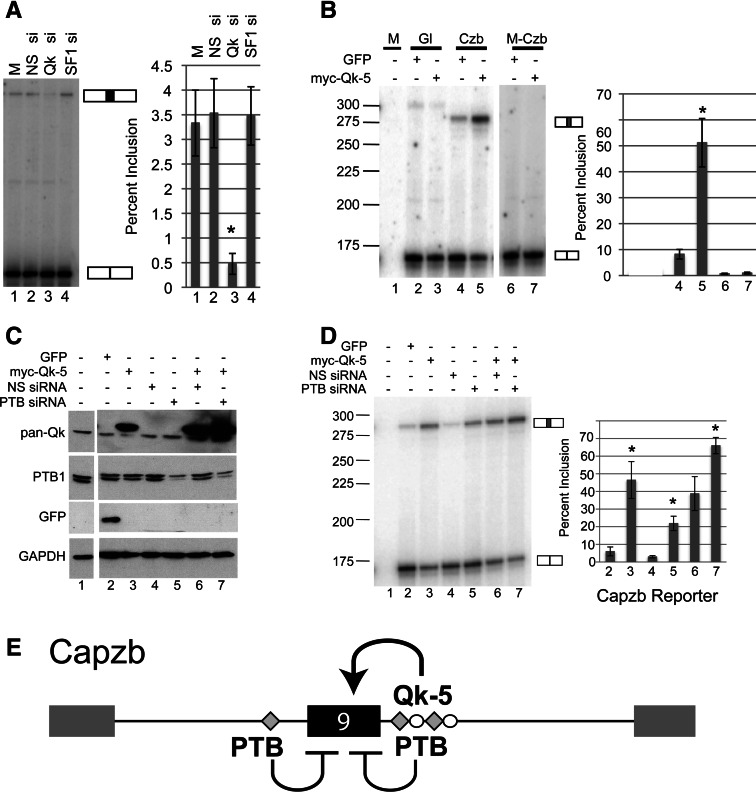
FIGURE 4.
QK and PTB control inclusion of Capzb exon 9. (A) Analysis of RT-PCR products from C2C12 cells mock-transfected (M) or transiently transfected with a nonspecific siRNA (NS si), a QK-specific siRNA (QK si), or an SF1-specific siRNA (SF1 si). Spliced products corresponding to exon 9-included or excluded endogenous Capzb mRNAs are indicated to the right of the gel. Percent inclusion was quantified and graphed, far right. (B) Overexpression of QK leads to Capzb exon 9 inclusion provided ACUAA elements are intact. Proliferating C2C12 cells were mock transfected (M) or transiently cotransfected with a QK-5 expression construct (myc-QK-5) or a control GFP expression construct (GFP), along with either the wild-type Capzb reporter (Czb) or the mutant reporter with deletion of the ACUAA elements (M-Czb) from Figure 2. A globin-only control is also shown (Gl, lanes 2,3); the band in the Gl lanes is a nonspecific RT-PCR product. Inclusion of the WT Capzb exon increased with expression of QK by approximately fivefold (cf. lanes 4 and 5, P < 0.001, n = 4). Spliced products are indicated and percent inclusion is graphed, far right. QK depletion significantly reduces exon inclusion (asterisk, P < 0.05, cf. lanes 2 and 3). (C) Western blot of whole-cell extract from cells mock-transfected (lane 1) or transiently cotransfected with the Capzb reporter and either a GFP expression construct (GFP), a QK-5 expression construct (myc-QK-5), a nonspecific siRNA (NS siRNA), or a PTB-specific siRNA (PTB siRNA) as indicated at top. Blots were probed with antibodies to GFP, pan-QK, PTB, and GAPDH as a loading control (as indicated to the left of the blots). (D) Analysis of RT-PCR products from RNA isolated from cells transfected in C. Spliced products are indicated to the right of the gel. Percent inclusion was quantified and graphed, far right. (*) P < 0.002. (E) Model for regulation of Capzb exon 9 by QK and PTB. QK activates inclusion through intronic ACUAA elements downstream, and PTB represses inclusion, possibly through sequences similar to PTB-binding sites upstream and/or through binding downstream, as detected by RNA affinity chromatography (Fig. 3).

