FIGURE 8.
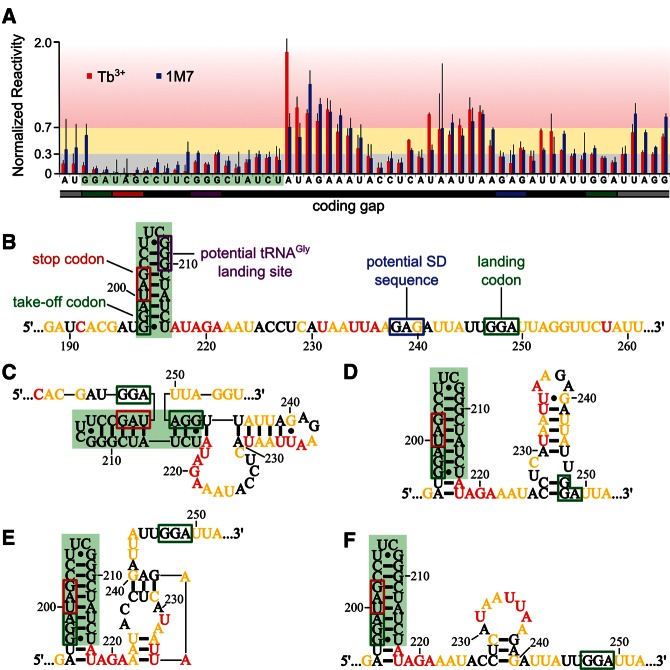
Compatibility between experimental probing data and previously proposed models. (A) Normalized reactivity for coding gap nucleotides from full-length gene 60 mRNA. Tb3+ data are red, and 1M7 data are blue. Shading is as described in Figure 3. (B) mRNA sequence of the gene 60 mRNA coding gap. Important coding gap features are labeled. Nucleotides are color-coded based on their Tb3+ reactivity range in full-length gene 60 mRNA, and the 5′ hairpin is shaded in green. Secondary structure models of the coding gap proposed by Huang et al. (1988) and Burke-Aguero et al. (1990) (C) and Le et al. (1993) (D–F; nucleotide colors as in B).

