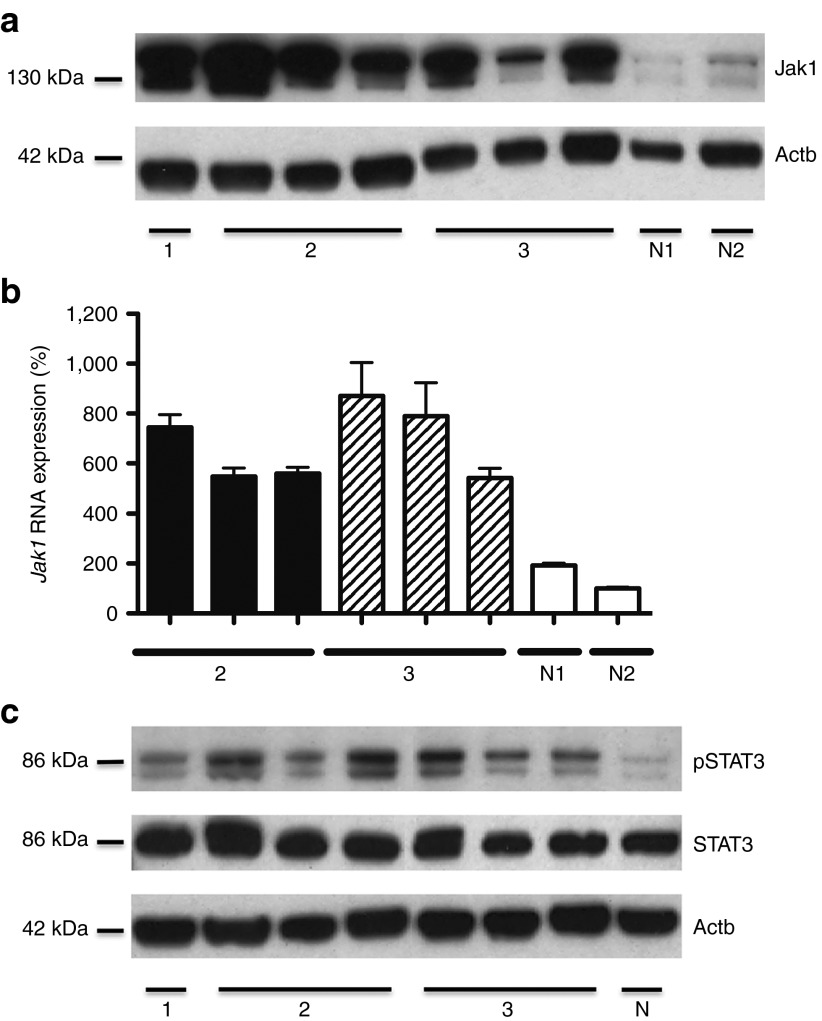
Figure 5.
Provirus-induced activation of the Jak/STAT-pathway. (a) Western blot analysis showing highly elevated levels of Jak1 in tumor tissue derived from spleen and lymph node carrying the insertion site in Jak1. Primary, secondary, and tertiary tumor samples are depicted by 1, 2, and 3, respectively. Untransduced OT-I cells isolated from RAG1−/− mice were used as negative control N1; ex vivo obtained EGFP-transduced OT-I T cells w/o RIS in Jak1 as negative control N2. (b) Elevated Jak1 RNA expression determined by real-time quantitative PCR. Measurements were performed in duplicates. Relative quantification was based on normalization on the housekeeping gene 18S rRNA. As negative controls, untransduced OT-I cells (N1) isolated from RAG1−/− mice and ex vivo obtained EGFP-transduced OT-I cells (N2) w/o RIS in Jak1 were used. RNA from the primary mature T-cell lymphoma was not isolated. (c) Western blot analysis showing the selective phosphorylation of STAT3 in tumor tissue obtained from spleen and lymph node carrying the RIS in Jak1. Phosphorylation of STAT5 could not be detected. Primary, secondary, and tertiary tumor samples are depicted by 1, 2, and 3, respectively. Untransduced OT-I T cells served as negative control (N).

