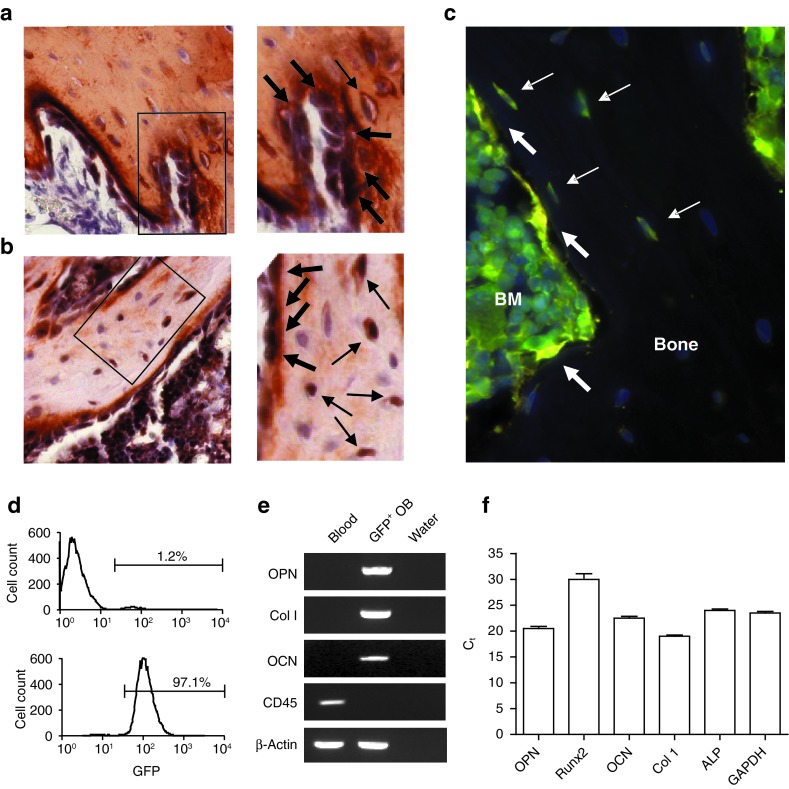
Figure 5.
Engrafted cells express osteoblast markers. (a,b) Double immunohistochemical staining of bone taken from a secondary recipient 3 weeks post-transplantation was positive for (a) both collagen I (red) and GFP (black) and (b) both osteocalcin (red) and GFP (black). Bar = 50 μm. The panels to the right, are digitally enlarged images of the respective boxed regions in a and b. Osteoblasts and osteocytes are indicated by thick and thin arrows, respectively. (c) Immunofluorescence microscopy of bone from a secondary recipient strongly stained for GFP (green) and lightly stained for osteocalcin (red) to minimize background fluorescence. Three yellow osteoblasts (thick arrows) and four green-yellow osteocytes (thin arrows) are indicated. (d) Flow cytometric analyses of culture-expanded osteoblasts before (top) and after (bottom) FACS enrichment for GFP expression. (e) Reverse transcriptase-PCR analysis showing expression of osteopontin (OPN), collagen I (Col I), and osteocalcin (OCN), but not CD45, in the GFP-enriched osteoblasts from d. (f) Quantitative reverse transcriptase-PCR showing the expression of five osteoblast genes compared with the GAPDH expression in the same cell population as in e. BM, bone marrow; Ct, threshold cycle; FACS, fluorescence-activated cell sorting; GAPDH, glyceraldehyde 3-phosphate dehydrogenase; GFP, green fluorescent protein.

