. 2013 Jun 4;2:e00411. doi: 10.7554/eLife.00411

Figure 10. Electrostatic surface potentials of L12-CTD, RF3 and other major translational GTPases.

Red surfaces are electronegative, blue surfaces electropositive. (A) The electrostatic surface potential of RF3 (B) Close-up of domain 1 in RF3, displaying the position of helix α7 in the G’ subdomain responsible for binding to L12-CTD ([C]; close-up in [D]). The overall surface potential of the G’ subdomain in RF3 is negative and the overall surface charge of helices α4 and α5 in L12-CTD is positive. Figure 10—figure supplement 1: Surface potentials of IF2 (A) and (B), EF-Tu (C) and (D), and EF-G (E) and (F) are all electronegative in domain 1.

DOI: http://dx.doi.org/10.7554/eLife.00411.018

Figure 10.

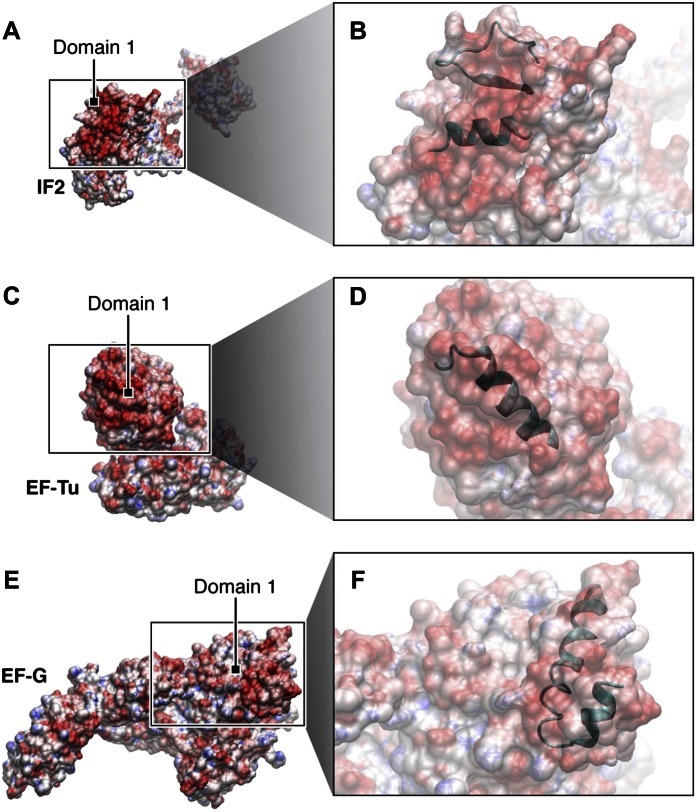
Figure 10—figure supplement 1. Surface potentials of IF1, EF-Tu and EF-G.

Figure 10—figure supplement 1.

Surface potentials of IF2 (A) and (B), EF-Tu (C) and (D), and EF-G (E) and (F) are all electronegative in domain 1, where they interact with the electropositive α4/α5 patch of L12-CTD. The close-ups display in ribbon the secondary structures involved in the interactions between L12-CTD and the major translational GTPases (Kothe et al., 2004; Allen et al., 2005; Helgstrand et al., 2007; Harms et al., 2008; Gao et al., 2009). PDB IDs are as follows: E. coli RF3: current study, modeled/fitted from 2H5E, E. coli L12-CTD: 1Ctf, E. coli IF2: 1ZO1, E. coli EF-Tu: 1DG1, E. coli EF-G: 2Wrk.