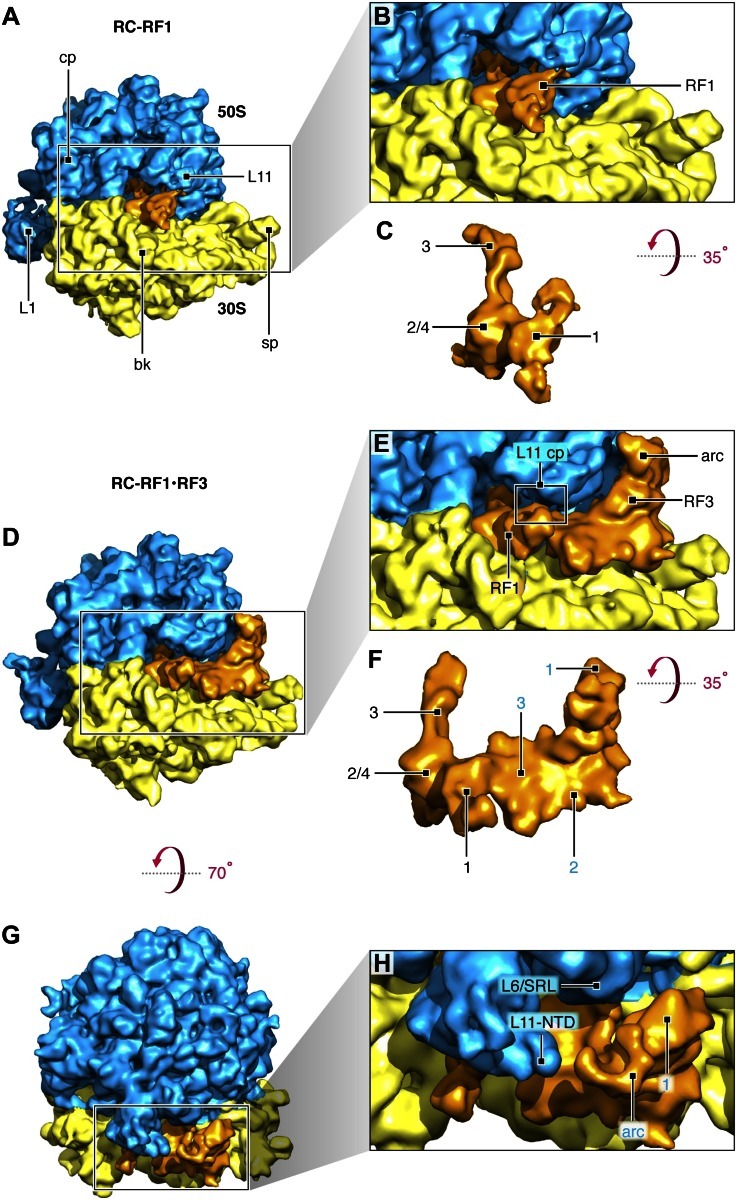
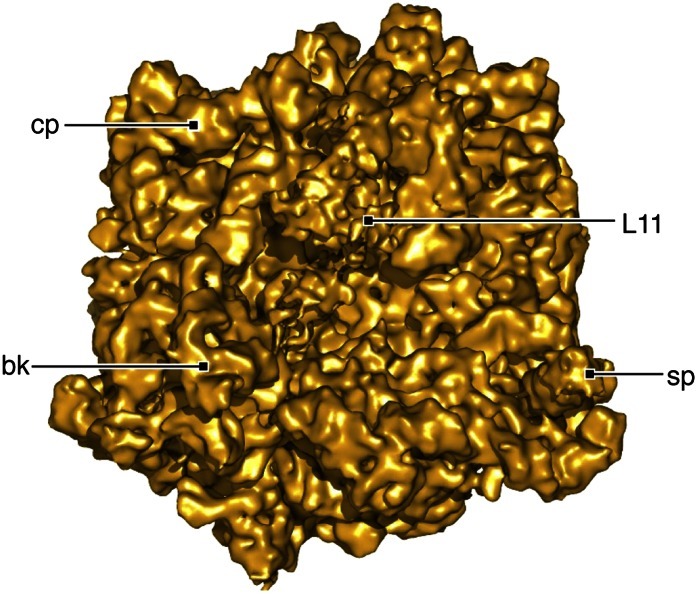
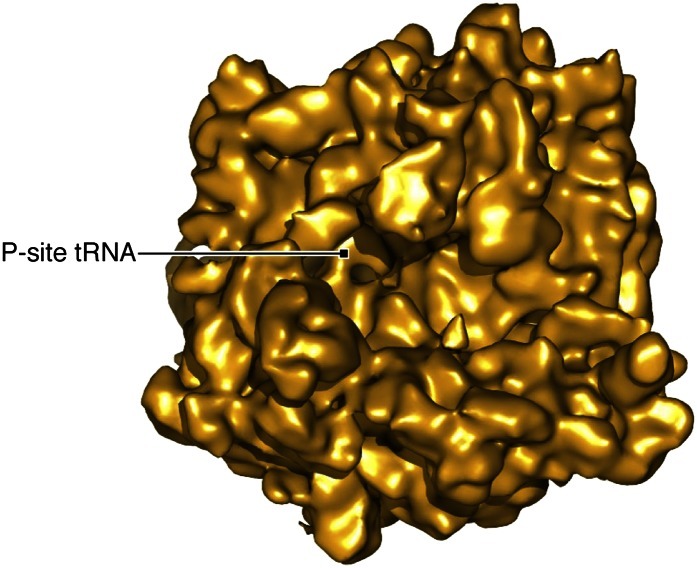
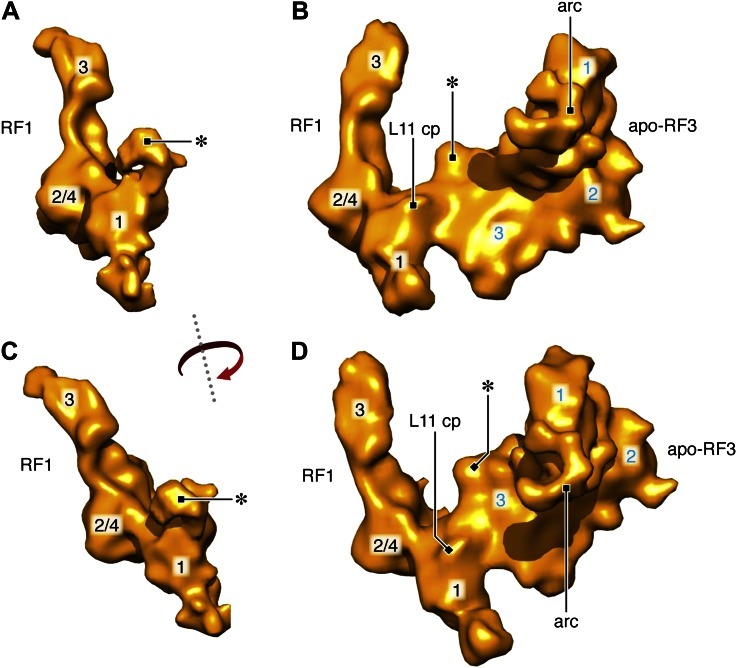
Figure 2. Termination complexes in association with RF1 alone and with both RF1 and apo-RF3.
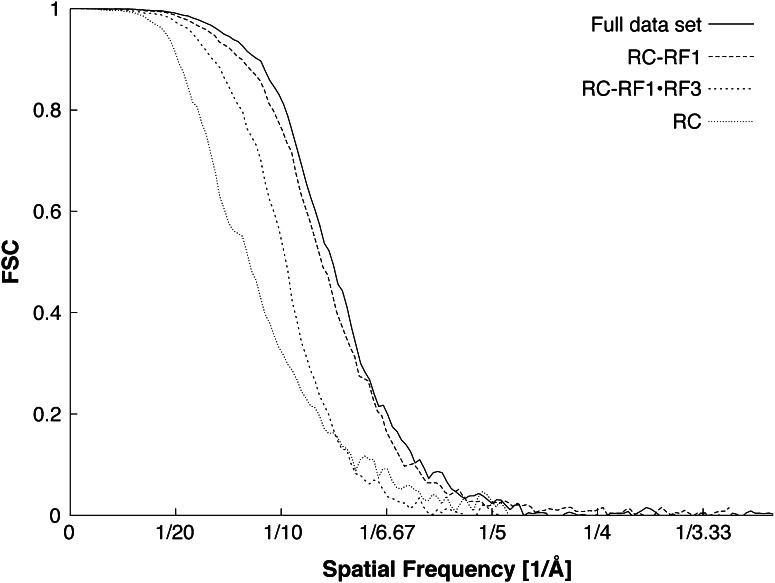
(A) RC-RF1 (resolution 8.4 Å). (B) Close-up of RF1 in the map. (C) RF1 density from (B). Domains 1, 2/4 and 3 of RF1 are labeled. (D) RC–RF1•RF3 (resolution 9.7 Å). (E) Close-up of RF1and apo-RF3 in the map. RF1 contacts both L11—L11 contact point is labeled ‘L11 cp’— and apo-RF3. (F) Density of RF1 and RF3 from (E): RF1 domains labeled in black and RF3 domains 1, 2 and 3 in blue. (G)–(H) In the RC–RF1•RF3 complex, apo-RF3 does not interact with L11 or L6/SRL. Labels: 30S: small ribosomal subunit (yellow), 50S: large ribosomal subunit (blue), cp: central protuberance, L11: ribosomal protein L11, sp: spur, bk: beak, L1: L1 stalk, RF1: release factor 1, RF3: release factor 3, L6/SRL: position of ribosomal protein L6 and the sarcin/ricin loop, L11-NTD: ribosomal protein L11 N-terminal domain, arc: arc-like density. Density maps obtained from the total data set and of the RC-class not occupied by RF1 or RF3 are presented in Figure 2—figure supplement 1 and Figure 2—figure supplement 2, respectively. Additional panels of isolated RF1- and RF1, apo-RF3-densities are presented in Figure 2—figure supplement 3. FSC curves for resolution assessment of all density maps obtained can be found in Figure 2—figure supplement 4.

