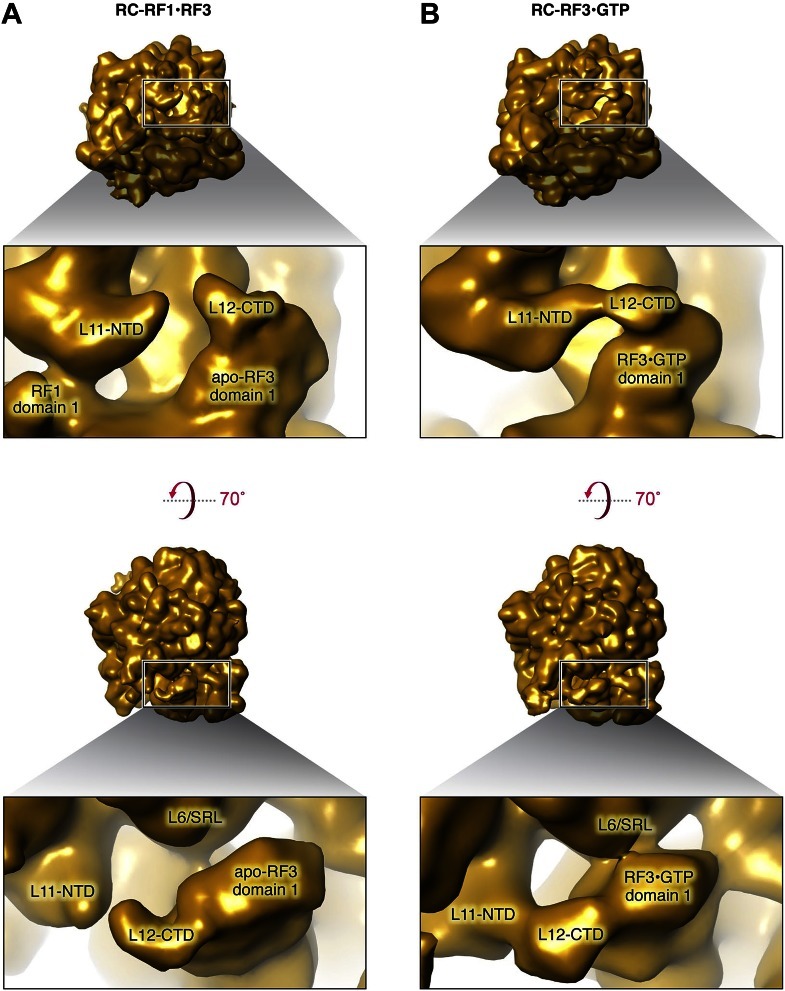
Figure 3. Comparison of L11, L6/SRL, arc (L12-CTD) and apo-RF3 in RC-RF1•RF3 and RC-RF3 maps.
(A) Apo-RF3 is observed in contact with L12-CTD (arc) but L12-CTD is not in contact with L11-NTD. Apo-RF3 domain 1 is not in contact with L6/SRL. In contrast (B), RF3•GTP is observed in contact with L6/SRL and in this map (RC-RF3•GTP), L12-CTD is in contact with both RF3 domain 1 and L11-NTD. Both maps are displayed at the resolution of the latter—16 Å—for direct comparison; unsegmented maps were chosen to avoid artifacts on the edges of protein densities and, hence, to present a correct analysis of the interactions occurring.

