Figure 4. Flexible fitting by MDFF focusing on RF1 conformation and interactions.
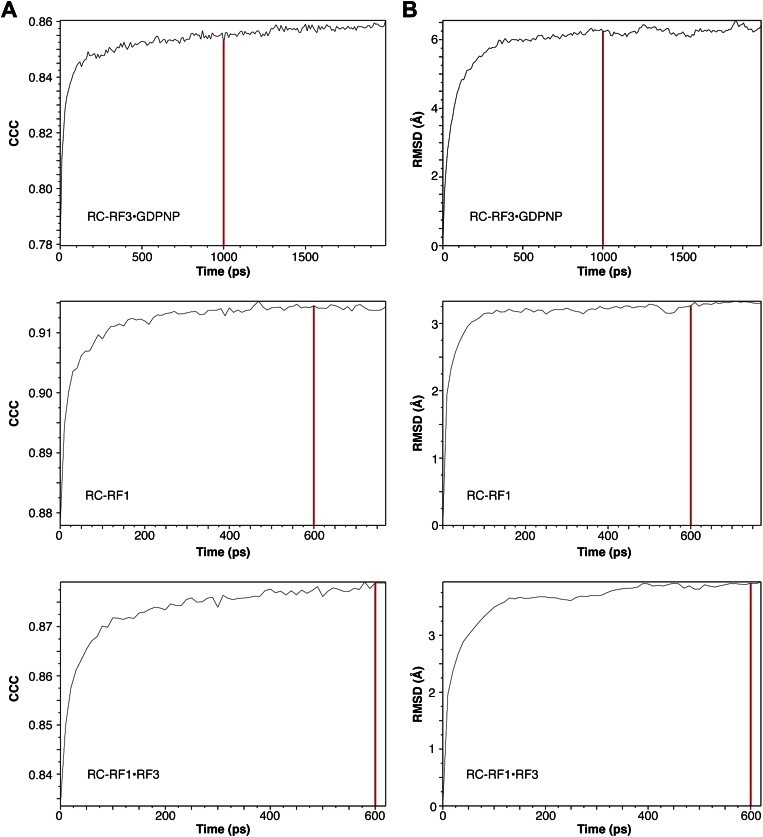
(A)–(C) Comparison of E. coli RF1 conformations after MDFF. (A) RF1 in RC-RF1. (B) RF1 (and RF3) in RC-RF1•RF3. (C) Superimposition of RF1 from (A) and (B). Arrow in (C) denotes the conformational change of domain 1. (D) In the RC-RF1 complex, RF1 interacts through helices α2 and α3 with the P-rich 310-helix in the L11-NTD. (E) In the RC-RF1•RF3 complex α3 (RF1) interacts with the 310-helix (L11-NTD), while α2 (RF1) interacts with RF3. α2 and α3 denote helices α2 and α3 in domain 1 of RF1; P-rich 310 denotes the P-rich 310 helix in L11-NTD. Root mean square deviation and cross correlation coefficient plots for our MD flexible fitting are presented in Figure 4—figure supplement 1.


