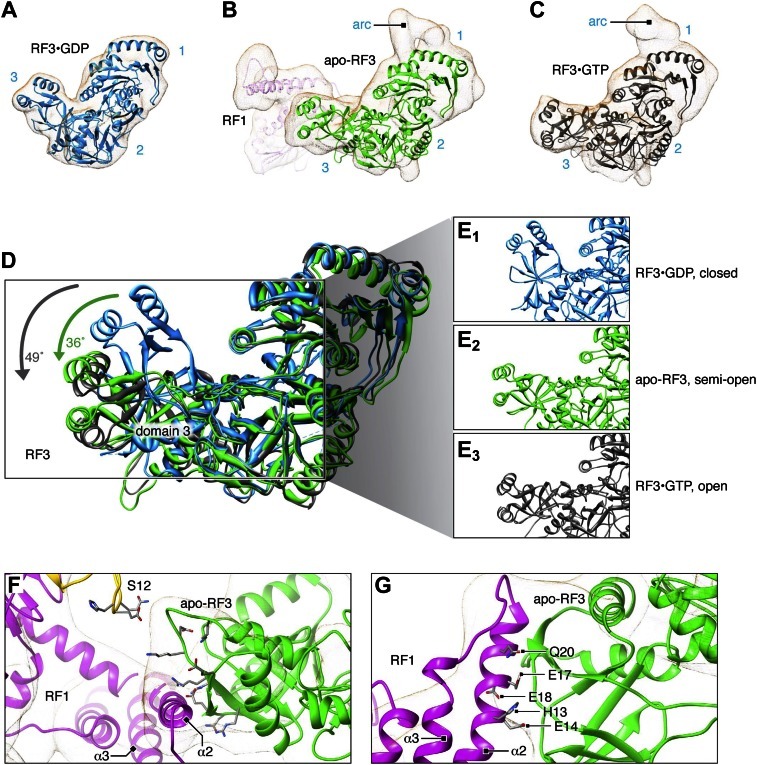
Figure 5. Flexible fitting by MDFF focusing on RF3 conformation and interaction with RF1.
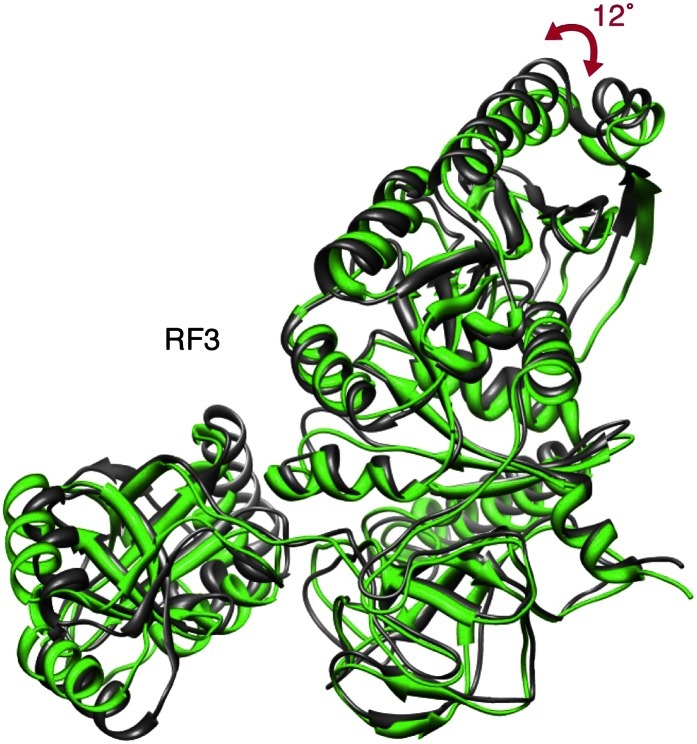
(A)–(C) Comparison of E. coli RF3 conformations after MDFF. (A) Crystal structure of free RF3•GDP displayed in its simulated density. (B) apo-RF3 (and RF1) in RC-RF1•RF3 (L12-CTD not displayed) (C) RF3 in RC-RF3•GDPNP (Gao et al., 2007) (L12-CTD not shown). Superimposition (D) of closed conformation RF3•GDP (blue), semi-open apo-RF3 (green) and closed RF3•GTP (gray). Arrows indicate rotations of domain 3. (E) Close-ups of domain 3 conformations from (A)–(D). (F) Candidate residues in domain 3 of RF3 for a charge-based interaction with RF1 and 30S protein S12. (G) Candidate residues in RF1 helix α2 for a charge-based interaction with RF3. RF3 domains labeled in blue; α2 and α3 denote helices α2 and α3 in domain 1 of RF1. Figure 5—figure supplement 1 shows superimposition of apo-RF3 and RF3•GDPNP.


