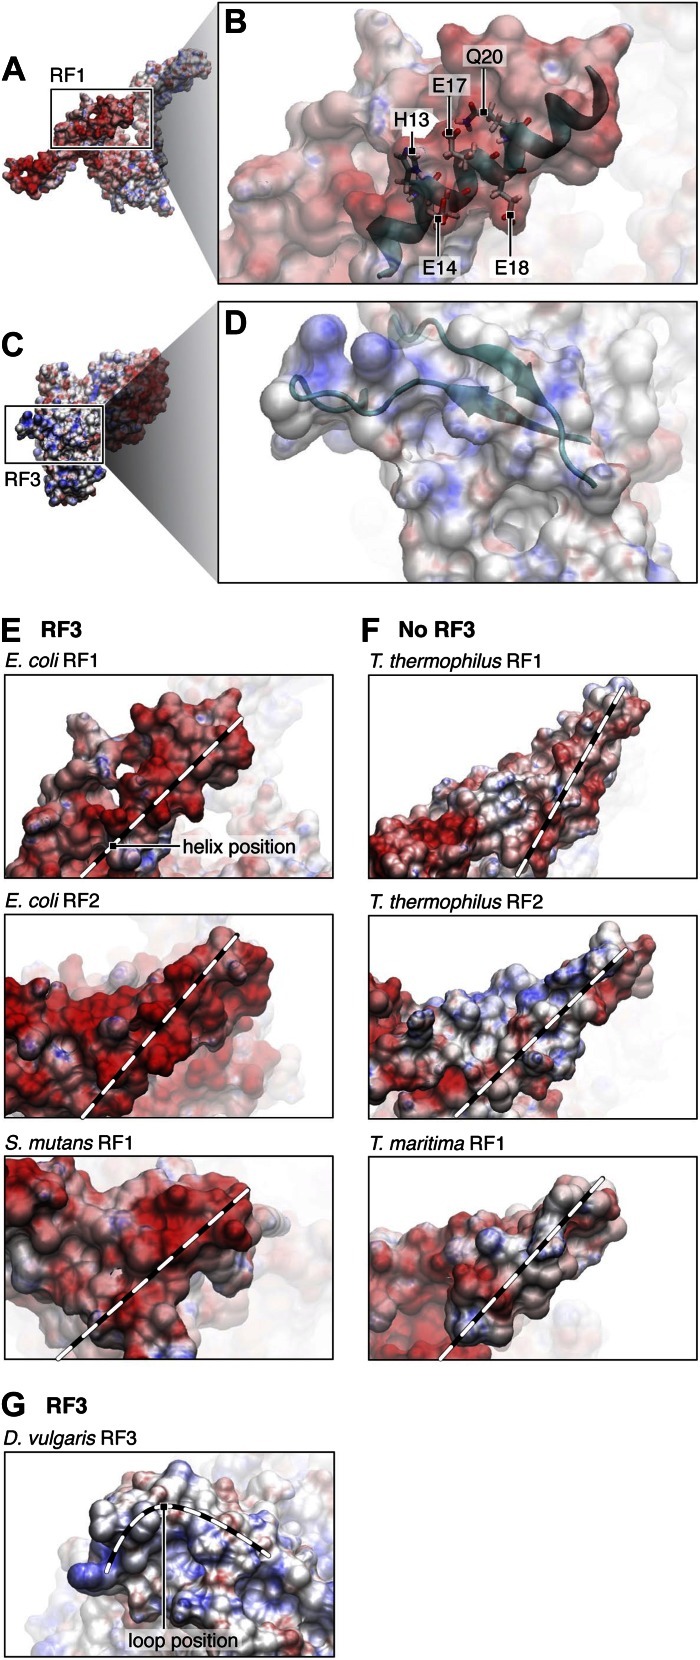
Figure 6. Electrostatic surface potentials of RF1 and RF3.
(A) Electrostatic surface potential of RF1. Red surfaces are electronegative, blue surfaces electropositive. (B) Close-up of helix α2 in RF1, where interaction with RF3 is mediated. Labeled residues (pointers) are candidates (as identified by MDFF) for a direct interaction with RF3. The surface potential of helix α2 is electronegative. (C) Electrostatic surface potential of RF3. (D) Close-up of the two loops in domain 3 of RF3 posing charged or polar residues for contact with RF1. The surface potential of RF3 in this region is electropositive, pointing to a charge-based interaction between RF1 and RF3. In Bacteria expressing RF3 (E) the surface potential of RF1 in the α2 helical region (position of helix α2 indicated by dotted lines) is overall electronegative. In comparison, this region in class-1 RFs from Bacteria and Archaea not expressing RF3 (F) is overall electroneutral. (G) RF3 from D. vulgaris displays an electropositive surface similar to what we observe in E. coli RF3 (position of the flexible loop region indicated by dotted line). PDB IDs; T. thermophilus RF1: 3D5A, T. thermophilus RF2: 2WH3, T. maritima RF1: 1RQ0, E. coli RF1: current study, modeled/fitted from 2B3T, E. coli RF2: 1Gqe, S. mutans RF1: 1Zbt, D. vulgaris RF3: 3Vqt.

