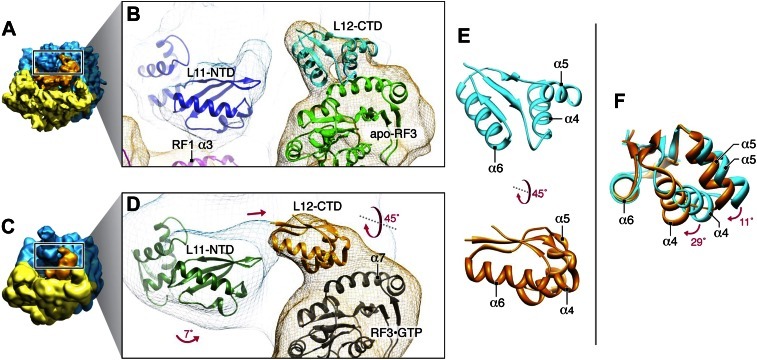
Figure 9. Dynamics of interactions involving RF3 and L12-CTD.
(A) RC-RF1•RF3 map. (B) Close-up of RF1 helix α3, apo-RF3, L12-CTD and L11-NTD after fitting. (C) RC-RF3•GDPNP map (Gao et al., 2007). (D) Close-up of RF3•GDPNP, L12-CTD and L11-NTD after fitting. (E) L12-CTD position in (B) (cyan) and (D) (orange) displayed side-by-side. (F) Superimposition of L12-CTD from (B) and (D) showing the ‘hinging-in’ conformational change observed.

