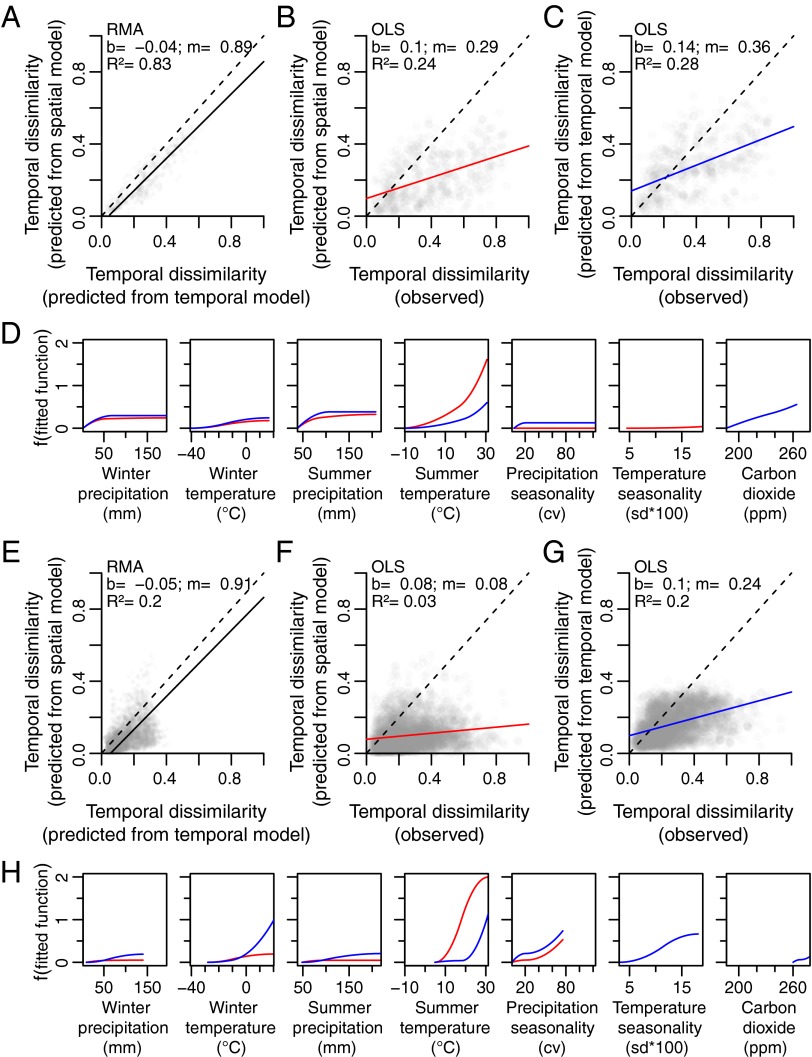
Fig. 2.
Predictions and fitted functions for the Late Pleistocene (21–11 kyBP) (A–D) and the Holocene (10–0 kyBP) (E–H). In all cases, the red lines indicate spatial datasets, blue lines indicate temporal datasets, and dashed lines indicate the 1:1 line. (A and E) Model-to-model RMA regression between temporal turnover predicted from the temporal model and from the spatial model. (B and F) Space-for-time OLS regression between observed temporal turnover and temporal turnover predicted from the spatial model. (C and G) Time-for-time OLS regression between observed temporal turnover and temporal turnover predicted from the temporal model. (D and H) Fitted functions for the spatial and temporal models. Abbreviations are as in Fig. 1.

