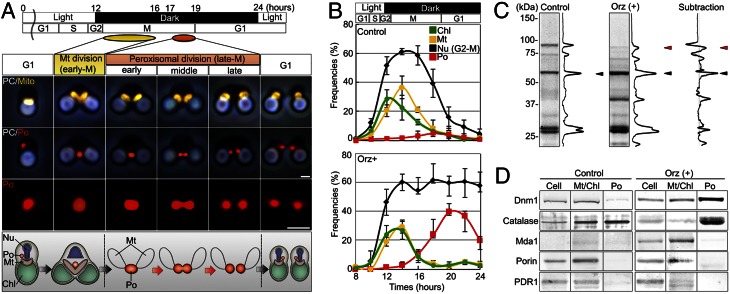
Fig. 1.
Identification of Dnm1 from the dividing-peroxisome fraction. (A) Immunofluorescence and schematic images of mitochondrial and peroxisomal divisions of C. merolae. Peroxisomal (red) division occurred after mitochondrial (yellow) division. Chl, chloroplast; Mt, mitochondrion; Nu, nucleus; PC, phase-contrast image; Po, peroxisome. (B) Frequencies of dividing cell nuclei (Nu), dividing chloroplasts (Chl), dividing mitochondria (Mt), and dividing peroxisomes (Po) in non–oryzalin-treated cells (control) and oryzalin-treated cells (Orz+) at the indicated times after synchronization (n > 100). (C) Proteomic analysis of peroxisomal fractions in control and oryzalin-treated cells at 20 h after synchronization. The major bands specific to oryzalin-treated cells were identified as catalase (black arrowhead), Dnm1 (red arrowhead), and others. (D) Immunoblot analyses of Dnm1, catalase, mitochondria division protein (Mda1), porin, and chloroplast division protein (PDR1). Cell, whole cell; Mt/Chl, isolated mitochondria and chloroplast; Po, isolated peroxisomes. (Scale bars: 1 μm.)

