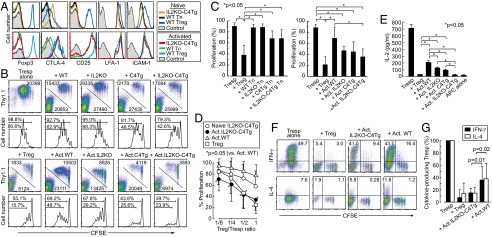
Fig. 4.

In vitro suppression by activated IL2KO-C4Tg CD4+ T cells. (A) Intracellular expression of Foxp3 and CTLA-4 and cell surface expression of CD25, LFA-1, and ICAM-1 by freshly prepared (Upper) or in vitro anti-CD3/anti-CD28/IL-2 activated T cells (Lower) prepared from indicated T-cell populations. (B) Proliferation of CFSE-labeled Thy1.1+ CD25−CD4+ responder T cells (Tresp) cocultured with Thy1.2+ CD25+CD4+ Treg or CD25−CD4+ Tn cells from depicted strains. The latter cells were freshly prepared or preactivated (Act) in vitro for 2 d by anti-CD3/anti-CD28/IL-2 stimulation. Staining for CFSE and Thy1.1 expression of live cells (Upper) and CFSE intensity of gated Thy1.1+ T cells (Lower) with the mean cell numbers and percentages in gated areas. (C) Percentages of dividing responder T cells in the coculture with indicated cells. (D) Proliferation of Thy1.1+ Tresp cells cocultured with graded numbers of designated populations of Thy1.2+ cells. Proportions of dividing Tresp cells were normalized by the proliferation of Tresp cells alone. *Significant difference from Tresp proliferation with WT activated T cells at each cell ratio. The means ± SDs of five independent experiments are shown. (E) IL-2 concentration (mean ± SD of triplicates) assessed by ELISA in the culture supernatants after 3-d culture. (F) Cytokine production by Tresp cells and designated groups of T cells cocultured under a Th1 (IL-12 and anti-IL-4) or Th2 (IL-4 and anti-IL-12) condition. Numbers indicate the percentages of cytokine-producing cells among Tresp cells and those among Thy1.1−Thy1.2+CFSE− cells. (G) Proportion of cytokine-producing Tresp cells in F is shown after normalization by the proportion without Thy1.2+ T cells. Representative results of at least three independent experiments are shown in A, E, and F.
