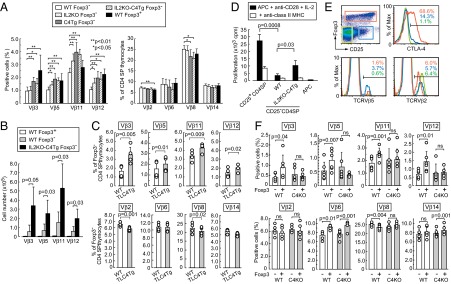
Fig. 7.

CTLA-4–dependent self-skewing of TCR repertoire in developing T cells and Foxp3+ Treg cells. (A and B) Proportions (A) and absolute numbers (B) (mean ± SD) of Foxp3+ or Foxp3− CD4SP thymocytes expressing each TCR Vβ subfamily in indicated groups of mice at 2–4 wk of age (n = 6–12 each). (C) Proportions of Foxp3− CD4SP thymocytes expressing indicated TCR Vβ subfamilies in 2- to 3-wk-old F1 mice of TLC4Tg C57BL/6 and normal BALB/c mice compared with WT F1 littermates. (D) Proliferation of indicated CD25+ or CD25− CD4SP BALB/c thymocytes cultured for 5 d with BALB/c splenic APCs, anti-CD28, and IL-2. Representative result (mean ± SD of triplicates) of three independent experiments is shown. (E) Subpopulations of BALB/c CD4SP thymocytes defined by the expression of CD25 and Foxp3 (Upper Left) and their expression of CTLA-4 and TCR Vβ5 or Vβ2. Representative of five independent stainings. (F) Proportions of Foxp3+ or Foxp3− CD4SP thymocytes expressing indicated TCR Vβ subfamilies in Treg-specific CTLA-4 conditional KO (C4KO) or WT BALB/c mice at 6 wk of age (n = 4–6 each). Circles represent individual mice; each column indicates the mean ± SD. ns, not significant.
