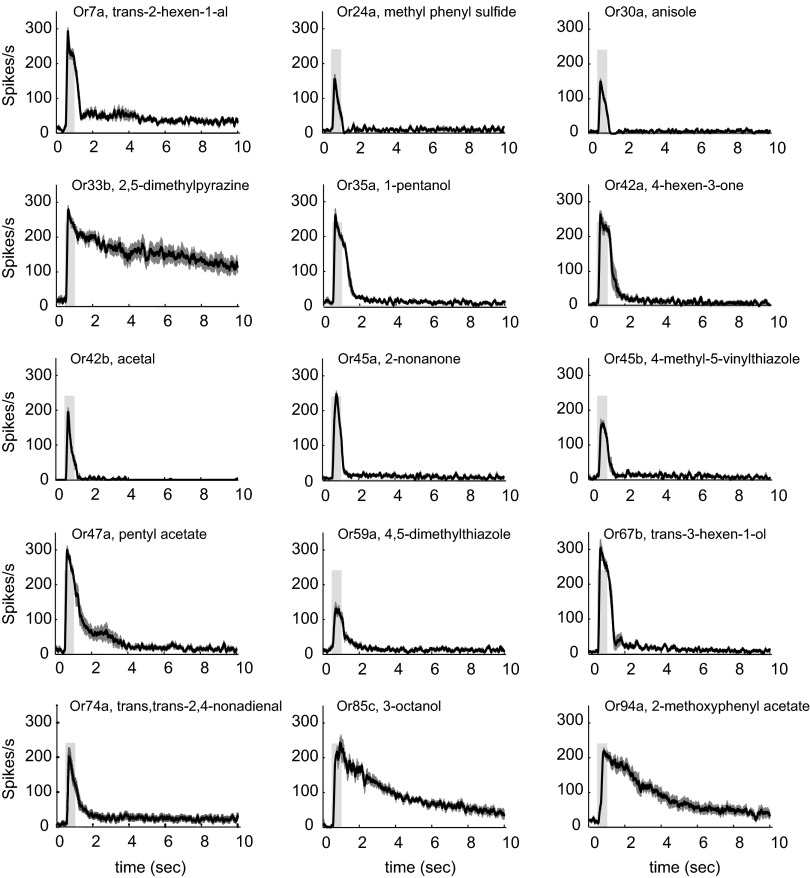
Fig. 3.
Temporal dynamics of responses of receptors to their most effective odorants. Peristimulus time histograms are shown for the 15 odorant–receptor combinations that yielded responses above background at 10−4 dilutions. The light gray bar indicates the 500-ms odorant pulse. SEM is indicated as gray bars (n = 6–8).

