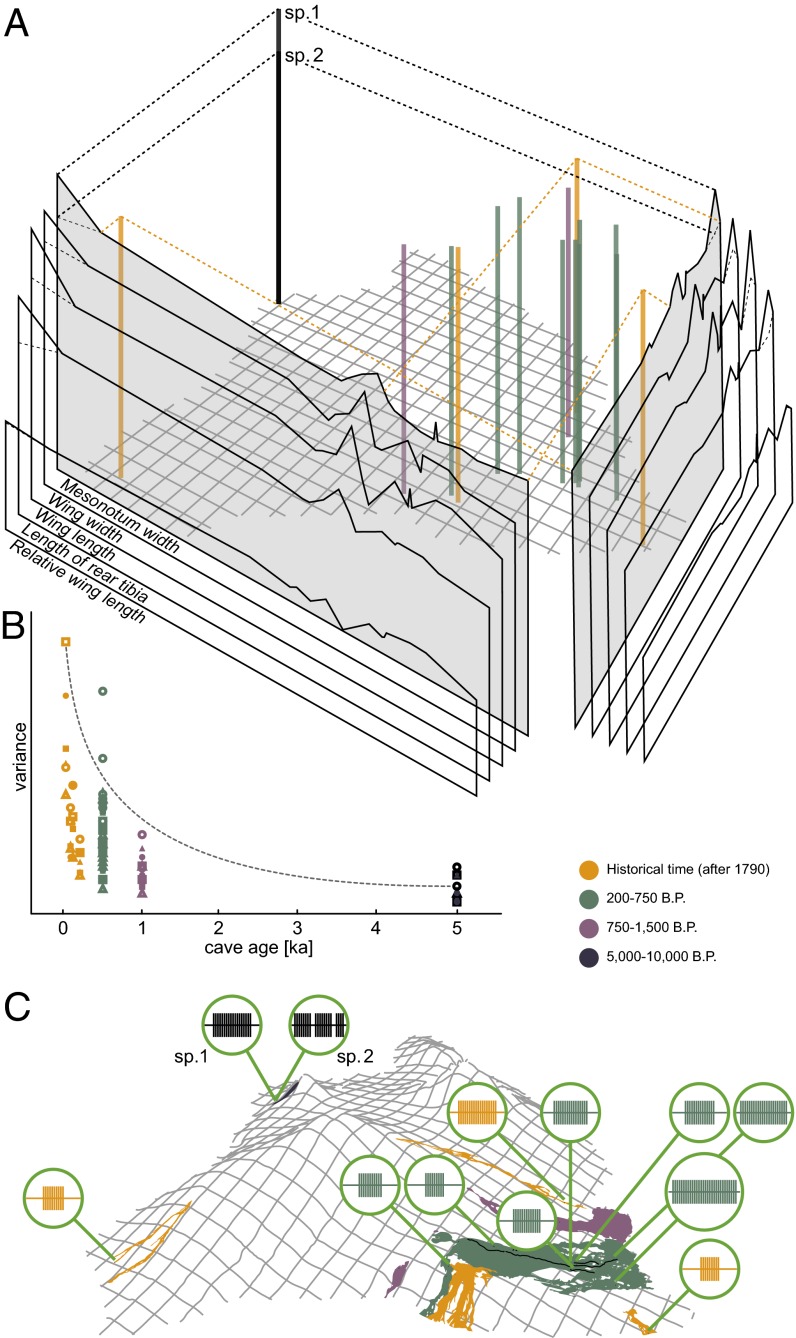
Fig. 1.
Phenotypic variation in the O. polyphemus complex. (A) Morphometric variation in five characters (population mean, relative scale) plotted against geography (compare C). Columns shown for mesonotum width only; for all other characters, only the resulting 2D projections are shown. (B) Scatterplot of variance in seven morphometric characters (denoted by symbols) against cave age. (C) Call-pattern variation (schematic representation is proportional to mean call length and pulse number) mapped on topography of Hawai‘i Island. Colors indicate cave age (see the legend in the figure).

