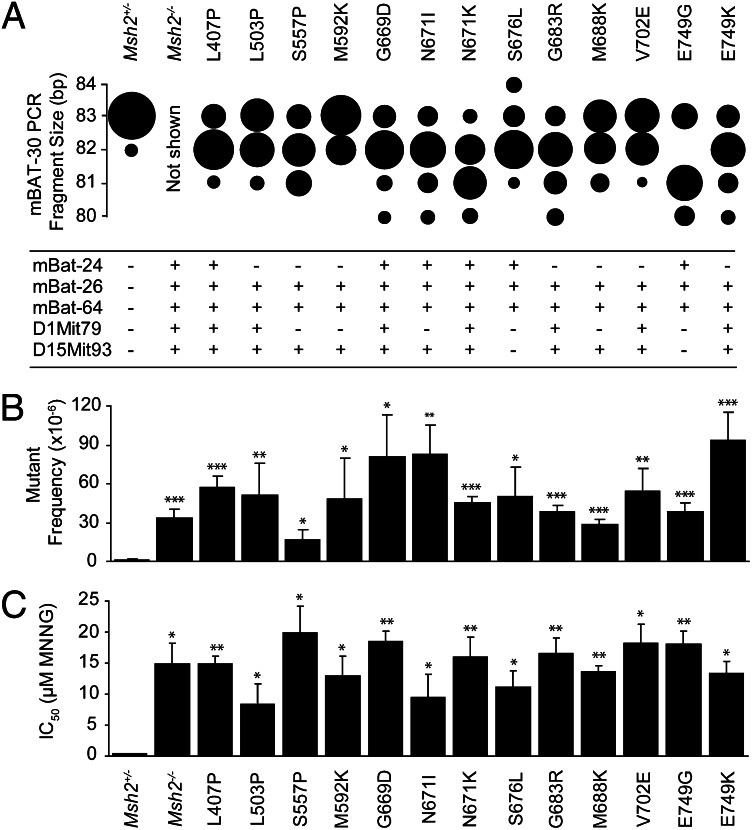
Fig. 3.
Analysis of the validation panel. (A) (Upper) Microsatellite instability analysis on mononucleotide microsatellite mBAT-30. The size of each sphere is proportional to the relative number of subclones with the indicated mBAT-30 PCR fragment length. All mutants from the validation panel display microsatellite instability (P < 0.05 compared with the Msh2+/− line). Microsatellite size shifts in the Msh2−/− control line are not displayed, as in this line the number of cell divisions before subcloning was much higher than in the lines of the validation panel, which makes a quantitative comparison impossible. (Lower) Microsatellite instability analysis on mononucleotide repeats mBAT-24, mBAT-26, and mBAT-64, and on dinucleotide repeats D1Mit79 and D15Mit93. +, MSI (P < 0.05 compared with the Msh2+/− line); −, no MSI. (B) Assessment of spontaneous mutator phenotypes at the genomic Hprt gene in Msh2-mutant mESC lines from the validation panel. Bars represent Hprt mutant frequencies ± SEM. *P < 0.05, **P < 0.01, ***P < 0.001 compared with the parental Msh2+/− line. (C) Tolerance to the methylating drug N-methyl-N′-nitro-N-nitrosoguanidine in Msh2-mutant mESC lines. Bars represent mean ± SEM. *P < 0.05, **P < 0.01, ***P < 0.001 compared with the parental Msh2+/− line.

