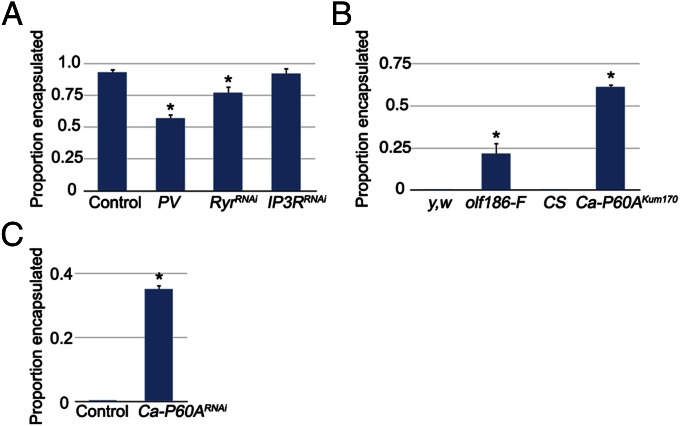
Fig. 3.
(A) Proportion of L. clavipes eggs encapsulated in the indicated genotypes. *P < 0.01 compared with control, error bars indicate SE in all graphs, within each graph, n = 3 independent replicates per genotype. (B) Proportion of G1 eggs encapsulated in the indicated genotypes. *P < 0.01 compared with genetic background controls. (C) Proportion of G1 eggs encapsulated in the indicated genotypes. *P < 0.01 compared with control.

