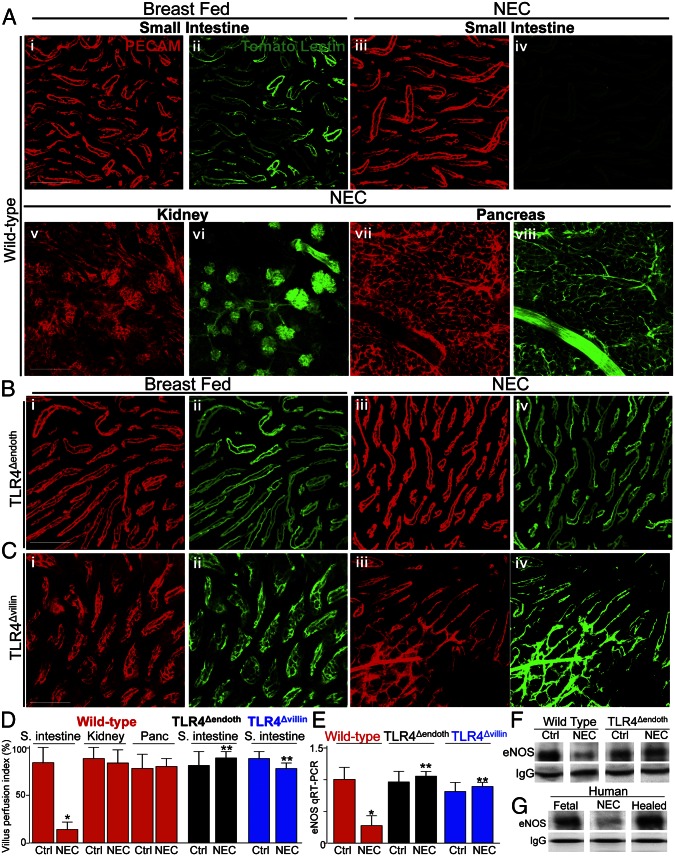
Fig. 3.
TLR4 signaling in the endothelium leads to impaired perfusion of the intestinal microcirculation in the pathogenesis of NEC and reduced expression of eNOS. (A–C) Representative confocal micrographs from whole mount sections of terminal ileum (A, i–iv; B; and C), kidney (A, v and vi), or pancreas (A, vii and viii), from wild-type (A), TLR4Δendoth (B), or TLR4Δvillin mice that were either breast fed (i and ii) or induced to develop NEC (A, iii–viii; B, iii and iv; and C, iii and iv). Mice were then subjected to intracardiac injection with the fluorescent tracer tomato lectin 5 min before they were killed. Whole mounts were immunostained with antibodies to PECAM-1 to assess the microvasculature of the indicated organ(red images); the corresponding blood flow (Lucifer yellow) appears in green. (D) VPI (mean ± SEM) as described in Materials and Methods. *P < 0.05 NEC vs. control; **P < 0.005 NEC wild-type vs. NEC TLR4Δendoth or TLR4Δvillin mice. (E) qRT-PCR (mean ± SEM) showing the expression of eNOS in wild-type, TLR4Δendoth, or TLR4Δvillin mice that were either breast-fed controls or induced to develop NEC as indicated. *P < 0.05 NEC vs. control; **P < 0.005 NEC in wild-type vs. TLR4Δendoth or TLR4Δvillin mice. (F and G) SDS/PAGE of immunoprecipitates of eNOS that had first been pulled down with antibodies to eNOS from intestinal MIMECs obtained from either the terminal ileum of wild-type or TLR4Δendoth mice that were either breast-fed controls or subjected to experimental NEC (F) or from the resected ileum from a fetus, from an infant with NEC, and a neonate 6 wk after the resolution of NEC at the time of stoma reversal (G). IgG is shown as a loading control. Results are representative of three separate experiments. (Scale bars: 100 μm.)

