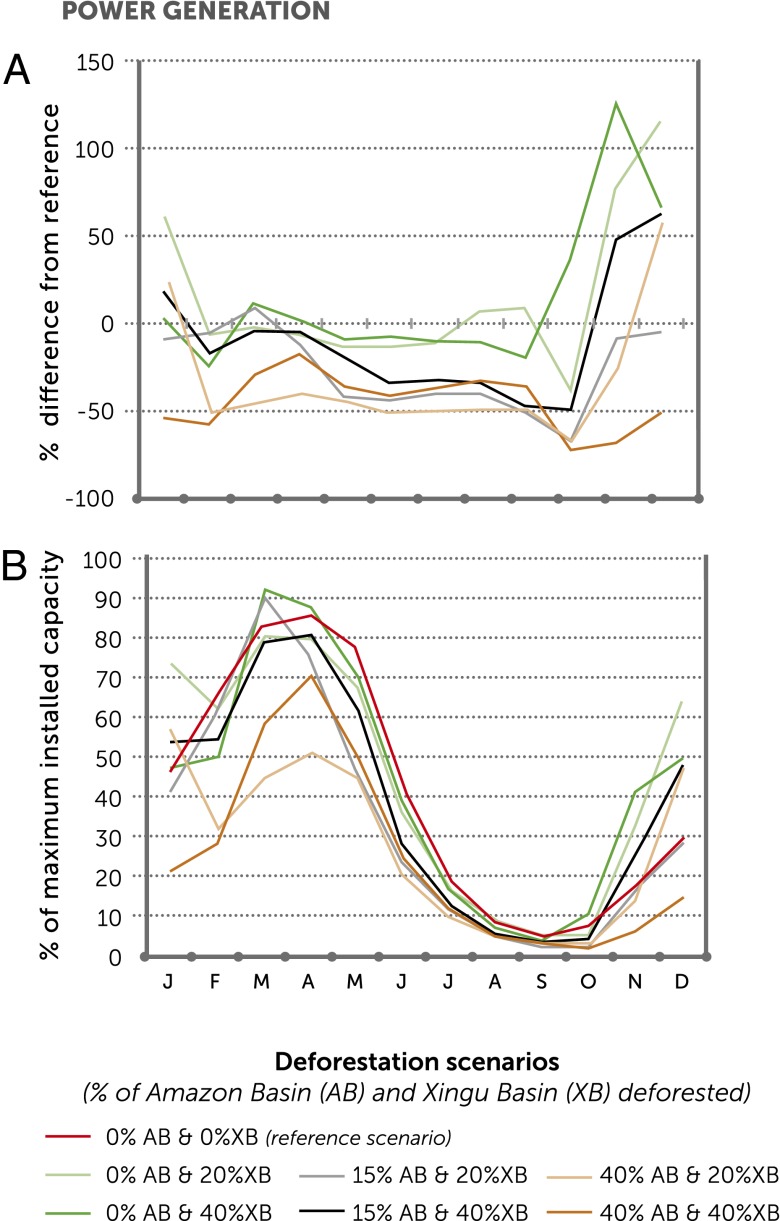
Fig. 4.
Difference in monthly power generation potential at the Belo Monte power plant on the Xingu River under alternative scenarios of local [Xingu Basin (XB)] and regional [Amazon Basin (AB)] forest cover, with climate feedbacks. (A) The percentage difference from reference scenario (0% AB and 0% XB) in mean monthly energy generation potential under six alternative scenarios. (B) Mean monthly power generation potential as a percentage of maximum installed capacity (11,000 MW) under seven alternative scenarios.

