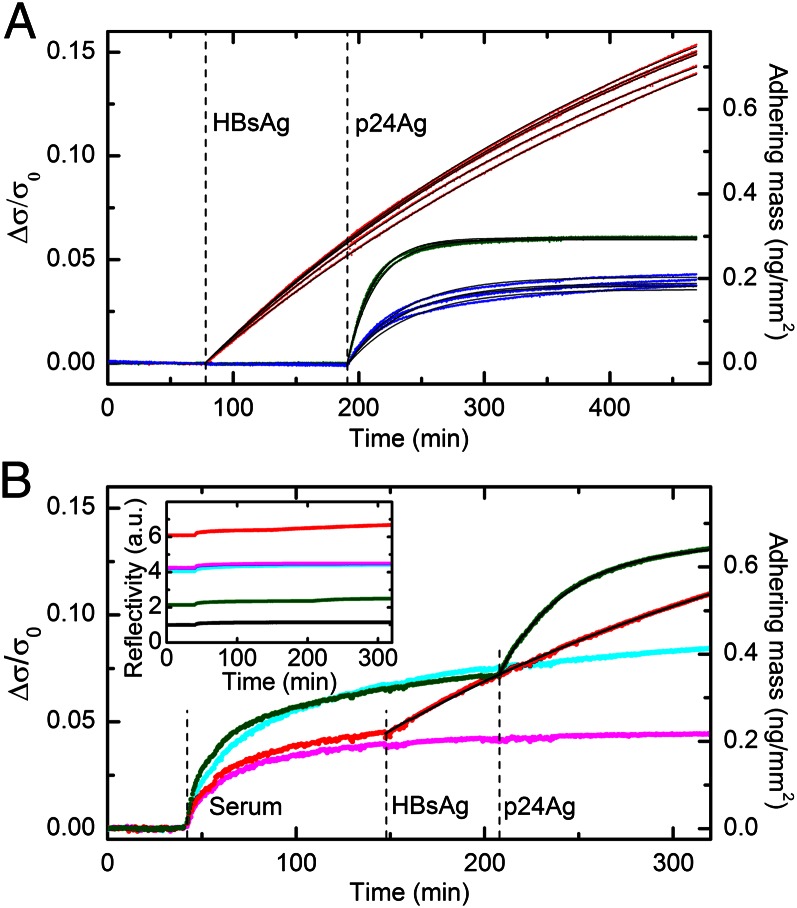
Fig. 2.
Quantification of bound target proteins. (A) The data shown in Fig. 1F are converted into the increase of normalized surface density Δσ/σ0 due to the adhesion of target molecules to spots of HBs(c)Ab (red), p24(c)Ab (blue), and p24(d)Ab (green). The right axis shows the corresponding surface density scale of the bound targets, assuming that σ0 = 4.9 ng/mm2 (SI Materials and Methods). The black lines represent single exponential fits yielding rates of 3.8 × 10⁻⁵ (±3 × 10⁻⁶) s−1 for HBs(c)Ab, 7.8 × 10⁻⁴ (±5 × 10⁻⁵) s−1 for p24(d)Ab, and 3.6 × 10⁻⁴ (±3 × 10⁻⁵) s−1 for p24(c)Ab. (B) The amount of adhering mass Δσ/σ0 is shown for two single spots of HBs(c)Ab (red) and p24(d)Ab (green) antibodies and for two control spots, CTR1 (cyan) and CTR2 (magenta). Bovine fetal serum was first added to the incubation buffer (dilution 1:10), and then HBsAg and p24Ag were injected to a final concentration of 52 ng/mL. The times of the additions are indicated by the vertical dashed lines. The right axis shows the corresponding scale of surface density at the top of the antibody spots. The signal contribution due to antigen binding is separated from that of nonspecific adsorption of serum by subtracting the CTR1 and CTR2 signals from the p24(d)Ab and HBs(c)Ab curves, respectively. The resulting curves are then fitted with single exponential functions (Fig. S1). The extracted rates are 4.5 × 10⁻⁴ s−1 and 5.8 × 10⁻⁵ s−1 for p24Ag and HBsAg, respectively. The black lines represent the exponential fitting curves added to the corresponding smoothened control signals. (Inset) Raw data of reflected light intensity corresponding to the curves shown in B. The black curve represents the signal obtained from the unspotted region.

