Fig. 3.
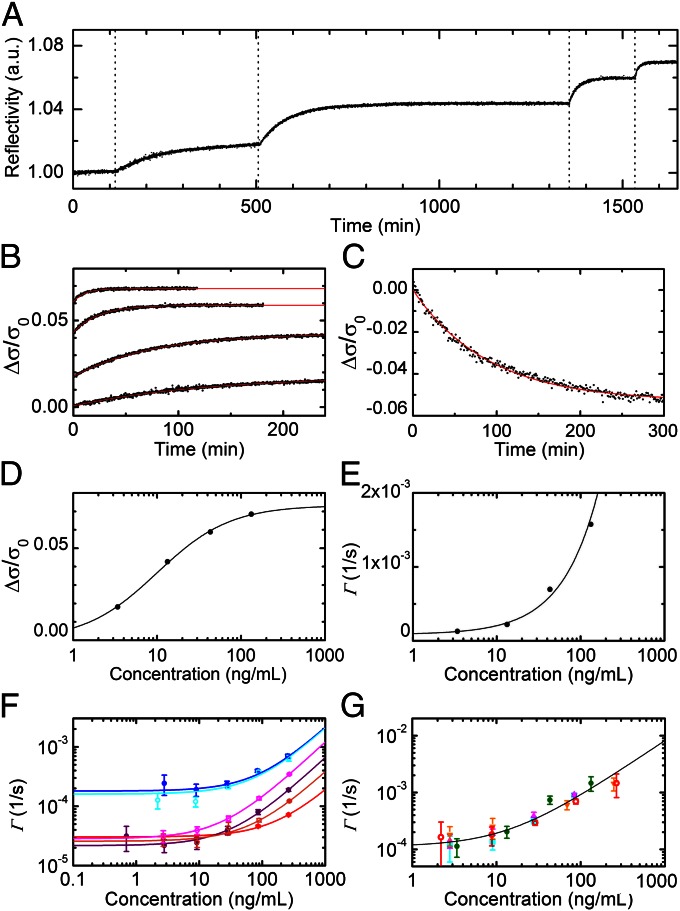
Kinetics of spotted antibodies recognition. (A) The time dependence of the reflected intensity of a single spot of p24(d)Ab antibodies was measured while the solution concentration of target protein was brought to 3.4, 13.3, 43.1, and 133 ng/mL at the times indicated by the vertical dotted lines. (B) The reflectivity curves of A are converted into the normalized mass of target molecules adhering to the spot. The curves are shown as a function of the time after each addition (black dots) together with their exponential fits (red lines). (C) A dissociation curve is measured for a p24(d)Ab spot after the experiment reported in A. The normalized mass on the spot decreases after the target solution is replaced with the incubation buffer. The red line represents an exponential fit yielding a koff of 1.8 × 10⁻⁴ (±4 × 10⁻⁵) s−1. (D) The asymptotic values extracted from the exponential fits reported in B are shown as a function of the target concentration (black circles) and are fitted, according to Eq. 2, by Δσ/σ0 = (Δσmax/σ0)/(1 + Kd/c) (black line), where Δσmax/σ0 = 0.073 (±0.001) and Kd = 416 (±26) pM. (E) The rates of the exponential fits reported in B are shown as a function of the target concentration (black circles) and are fitted by Γ(c) = konc + koff (black line), yielding kon = 2.9 × 10⁵ (±2 × 10⁴) M−1⋅s−1 and koff = 8.6 × 10⁻⁵ (±4.8 × 10⁻⁵) s−1. (F) Association rates measured for different interactions when increasing concentrations of the corresponding target are progressively added to the solution: p24(c)Ab, HBs(c)Ab, and HBs(d)Ab interactions in incubation buffer are reported as solid blue, red, and purple circles, respectively, whereas the same interactions in diluted bovine serum are represented by open cyan, orange, and magenta circles, respectively. Each value represents the average rate obtained from four to eight spots, and the error bars indicate the corresponding SDs. Each solid line represents a linear fit of the Γ(c) points with the corresponding color. All of the extracted parameters are reported in Table 1. (G) Association rates of p24Ag on spots of p24(d)Ab measured in five experiments similar to those shown in A: The average rate obtained from four to eight spots is reported for four repetitions in incubation buffer (green circles, magenta up triangles, orange down triangles, and cyan squares) and one in diluted bovine serum (open red dots). The error bars indicate the corresponding SDs. The solid line represents a linear fit of all of the reported values of Γ(c), yielding kon = 1.9 × 10⁵ (±2 × 10⁴) M−1⋅s−1 and koff = 1.3 × 10⁻⁴ (±2 × 10⁻⁵) s−1.

