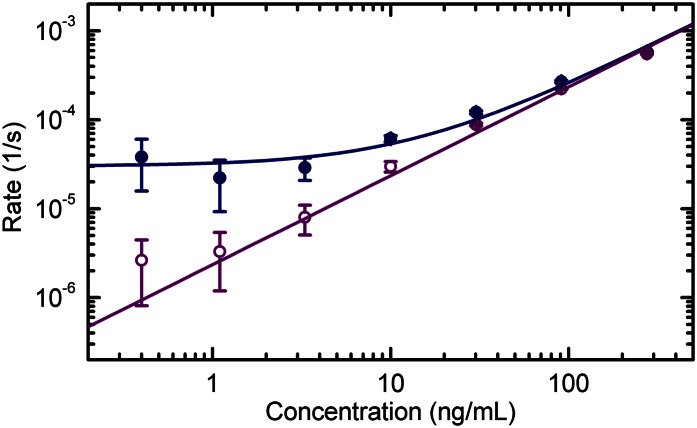
Fig. 4.
Association rate and initial slope of the binding curves. The rates obtained from the exponential fits of the binding curves (solid blue circles) and the slopes of the initial linear growth of φ(t) (open violet circles) are reported for spots of anti-mouse IgG antibodies when increasing concentrations of mouse IgG were progressively added in buffer solution. Each value represents the average rate obtained from six spots, and the error bars indicate the corresponding SDs. The solid lines represent linear fits with Γ(c) = konc + koff (blue) and Γi(c) = konc (violet), being the values of kon obtained from the two analyses substantially identical. The obtained values of kon and koff are reported in Table 1.

