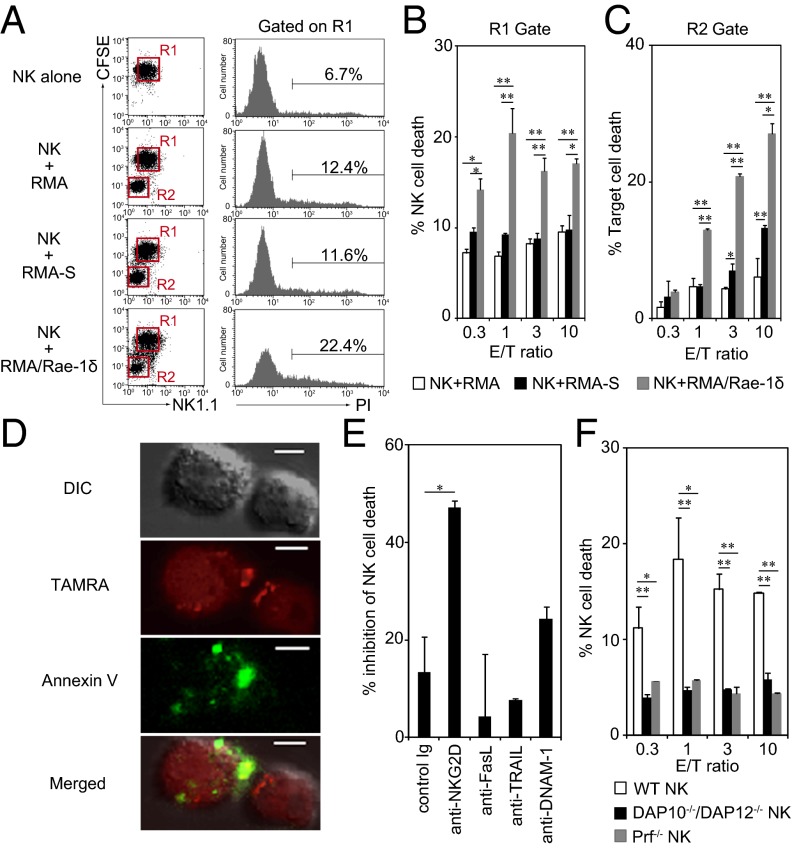
Fig. 1.
NK cell death is mediated through the NKG2D-induced perforin pathway. (A–C) NK cell death and target cell death in the same culture. NK cells were labeled with CFSE and then cocultured with RMA, RMA-S, or RMA/Rae-1δ at a 1:1 ratio (A) or the indicated ratios (B and C) for 2 h. Cells were stained with anti-NK1.1 mAb and propidium iodide (PI), and then percent cell death of R1-gated NK (PI+ CFSE+ NK1.1+ cells/CFSE+ NK1.1+ cells) and of R2-gated tumor (PI+ CFSE− NK1.1− cells/CFSE− NK1.1− cells) was calculated. Representative PI staining of NK cells (gray histograms) are shown in A. Percent NK cell death (B) and percent tumor cell death (C) are shown as means plus SDs of triplicates. *P < 0.05, **P < 0.01. (D) TAMRA-labeled NK cells cocultured with RMA/Rae-1δ were stained with FITC-conjugated annexin V and analyzed by confocal microscopy. (Scale bars, 5 μm.) (E) CFSE-labeled NK cells were treated with the indicated blocking mAb. Percent inhibition of cell death by mAbs was calculated by comparing the percent NK cell death in the presence of mAb with that in the absence of mAb. *P < 0.05; compared with control rat IgG. (F) NK cells from DAP10−/−/DAP12−/−, Prf−/−, or WT mice were cocultured with RMA/Rae-1δ, and percent NK cell death was analyzed. Data represent means plus SDs of triplicates. *P < 0.05, **P < 0.01; compared with WT NK. Similar results were obtained in three (A–C) or two (D–F) independent experiments.

